

Irreversible change in the T1 temperature dependence with thermal dose using the proton resonance frequency-T1 technique
- PMID: 22576265
- PMCID: PMC3461236
- DOI: 10.1002/mrm.24322
Irreversible change in the T1 temperature dependence with thermal dose using the proton resonance frequency-T1 technique
Abstract
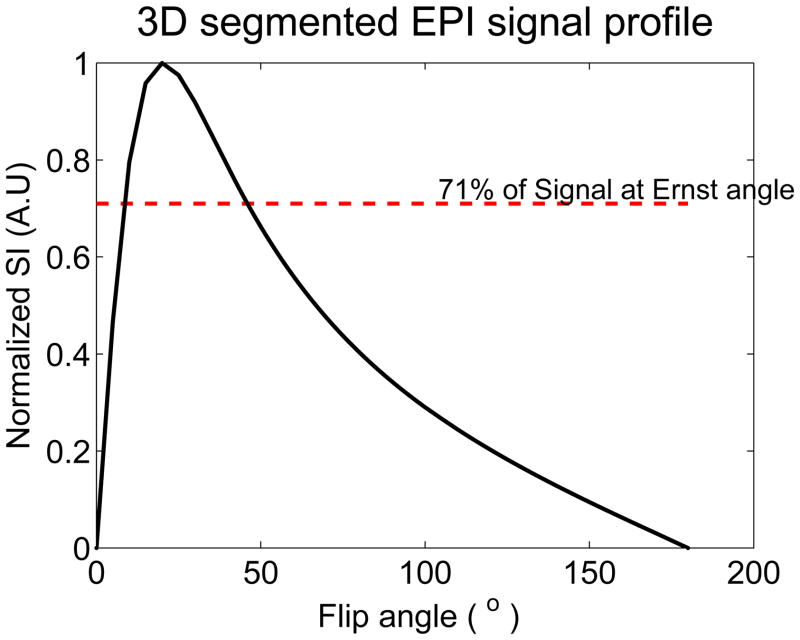
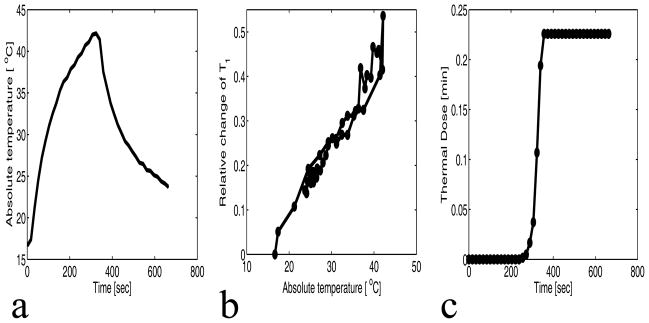
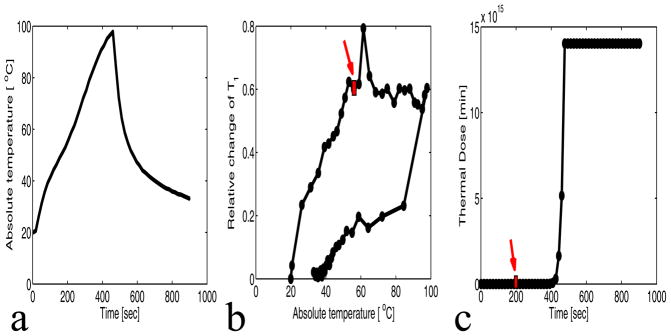
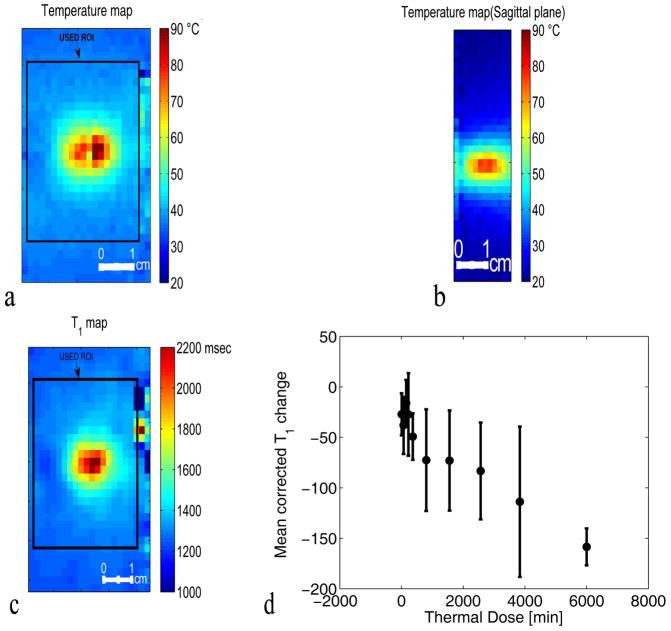
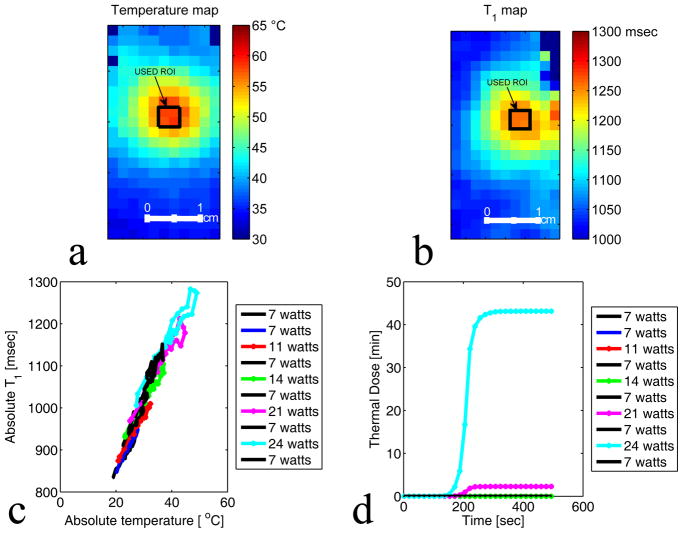
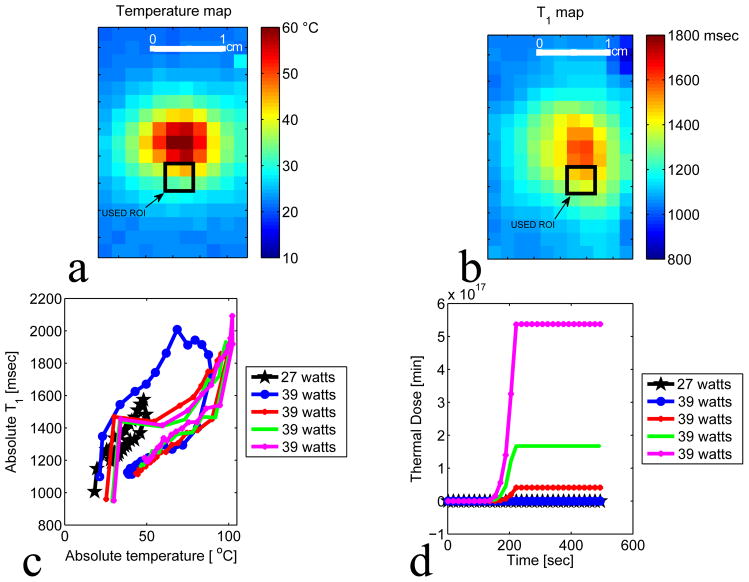
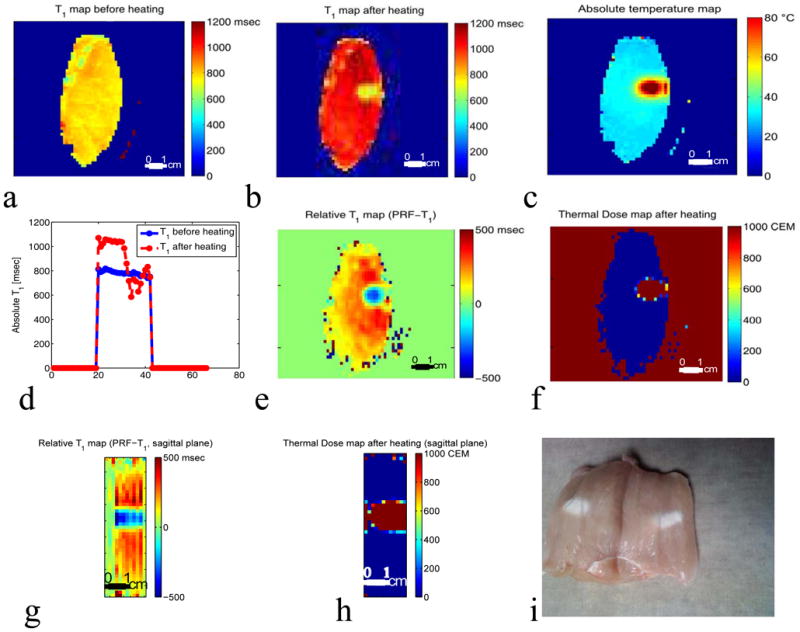
Denaturation of macromolecules within the tissues is believed to be the major factor contributing to the damage of tissues upon hyperthermia. As a result, the value of the spin-lattice relaxation time T1 of the tissue water, which is related to the translational and rotational rates of water, represents an intrinsic probe for investigating structural changes in tissues at high temperature. Therefore, the goal of this work is to investigate whether the simultaneous measurement of temperature and T1 using a hybrid proton resonance frequency (PRF)-T1 measurement technique can be used to detect irreversible changes in T1 that might be indicative of tissue damage. A new hybrid PRF-T1 sequence was implemented based on the variable flip angle driven-equilibrium single-pulse observation (DESPOT)1 method from a standard three dimensional segmented echo-planar imaging sequence by alternating two flip angles from measurement to measurement. The structural changes of the heated tissue volumes were analyzed based on the derived T1 values and the corresponding PRF temperatures. Using the hybrid PRF-T1 technique, we demonstrate that the change of spin lattice relaxation time T1 is reversible with temperature for low thermal dose (thermal dose ≤ 240 cumulative equivalent minutes [CEM] 43°C) and irreversible with temperature after significant accumulation of thermal dose in ex vivo chicken breast tissue. These results suggest that the hybrid PRF-T1 method may be a potentially powerful tool to investigate the extent and mechanism of heat damage of biological tissues.
Copyright © 2012 Wiley Periodicals, Inc.
Figures
Similar articles
-
Magnetic resonance thermometry and its biological applications - Physical principles and practical considerations.Prog Nucl Magn Reson Spectrosc. 2019 Feb;110:34-61. doi: 10.1016/j.pnmrs.2019.01.003. Epub 2019 Jan 31. Prog Nucl Magn Reson Spectrosc. 2019. PMID: 30803693 Free PMC article. Review.
-
T1 and T2 temperature dependence of female human breast adipose tissue at 1.5 T: groundwork for monitoring thermal therapies in the breast.NMR Biomed. 2015 Nov;28(11):1463-70. doi: 10.1002/nbm.3410. Epub 2015 Sep 24. NMR Biomed. 2015. PMID: 26403166
-
A variable flip angle golden-angle-ordered 3D stack-of-radial MRI technique for simultaneous proton resonant frequency shift and T1 -based thermometry.Magn Reson Med. 2019 Dec;82(6):2062-2076. doi: 10.1002/mrm.27883. Epub 2019 Jun 30. Magn Reson Med. 2019. PMID: 31257639
-
Correction of proton resonance frequency shift MR-thermometry errors caused by heat-induced magnetic susceptibility changes during high intensity focused ultrasound ablations in tissues containing fat.Magn Reson Med. 2014 Dec;72(6):1580-9. doi: 10.1002/mrm.25063. Epub 2013 Dec 17. Magn Reson Med. 2014. PMID: 24347129
-
Quantifying temperature-dependent T1 changes in cortical bone using ultrashort echo-time MRI.Magn Reson Med. 2015 Dec;74(6):1548-55. doi: 10.1002/mrm.25994. Epub 2015 Sep 21. Magn Reson Med. 2015. PMID: 26390357 Free PMC article.
Cited by
-
Magnetic resonance thermometry and its biological applications - Physical principles and practical considerations.Prog Nucl Magn Reson Spectrosc. 2019 Feb;110:34-61. doi: 10.1016/j.pnmrs.2019.01.003. Epub 2019 Jan 31. Prog Nucl Magn Reson Spectrosc. 2019. PMID: 30803693 Free PMC article. Review.
-
Treatment envelope evaluation in transcranial magnetic resonance-guided focused ultrasound utilizing 3D MR thermometry.J Ther Ultrasound. 2014 Oct 16;2:19. doi: 10.1186/2050-5736-2-19. eCollection 2014. J Ther Ultrasound. 2014. PMID: 25343028 Free PMC article.
-
In vivo simultaneous proton resonance frequency shift thermometry and single reference variable flip angle T1 measurements.Magn Reson Med. 2025 May;93(5):2070-2085. doi: 10.1002/mrm.30413. Epub 2025 Jan 20. Magn Reson Med. 2025. PMID: 39831523 Free PMC article.
-
Simultaneous proton resonance frequency T1 - MR shear wave elastography for MR-guided focused ultrasound multiparametric treatment monitoring.Magn Reson Med. 2023 Jun;89(6):2171-2185. doi: 10.1002/mrm.29587. Epub 2023 Jan 19. Magn Reson Med. 2023. PMID: 36656135 Free PMC article.
-
A k-space-based method to measure and correct for temporal B0 field variations in MR temperature imaging.Magn Reson Med. 2022 Sep;88(3):1098-1111. doi: 10.1002/mrm.29275. Epub 2022 May 16. Magn Reson Med. 2022. PMID: 35576148 Free PMC article.
References
-
- Hill CR, Bamber JC, ter Haar GR. Physical Principles of Medical Untrasonics. 2. Chichester, U. K: Wiley; 2004.
-
- Kremkau FW. Cancer therapy with ultrasound: a historical review. J Clin Ultrasound. 1979;7(4):287–300. - PubMed
-
- Dickinson RJ, Hall AS, Hind AJ, Young IR. Measurement of changes in tissue temperature using MR imaging. J Comput Assist Tomogr. 1986;10(3):468–472. - PubMed
-
- Ishihara Y, Calderon A, Watanabe H, Okamoto K, Suzuki Y, Kuroda K, Suzuki Y. A precise and fast temperature mapping using water proton chemical shift. Magn Reson Med. 1995;34(6):814–823. - PubMed
-
- Parker DL, Smith V, Sheldon P, Crooks LE, Fussell L. Temperature distribution measurements in two-dimensional NMR imaging. Med Phys. 1983;10(3):321–325. - PubMed
Publication types
MeSH terms
Substances
Grants and funding
LinkOut - more resources
Full Text Sources
Medical
Research Materials
