. 2012 Oct;33(9):1702-9.
doi: 10.3174/ajnr.A3071. Epub 2012 May 10.

In vivo X-ray digital subtraction and CT angiography of the murine cerebrovasculature using an intra-arterial route of contrast injection

Affiliations

In vivo X-ray digital subtraction and CT angiography of the murine cerebrovasculature using an intra-arterial route of contrast injection

G Figueiredo et al. AJNR Am J Neuroradiol. 2012 Oct.

Abstract

Background and purpose: Investigation of the anatomy, patency, and blood flow of arterial and venous vessels in small animal models of cerebral ischemia, venous thrombosis, or vasospasm is of major interest. However, due to their small caliber, in vivo examination of these vessels is technically challenging. Using micro-CT, we compared the feasibility of in vivo DSA and CTA of the murine cerebrovasculature using an intra-arterial route of contrast administration.

Materials and methods: The ECA was catheterized in 5 C57BL/6J mice. During intra-arterial injection of an iodized contrast agent (30 μL/1 sec), DSA of the intra- and extracranial vessels was performed in mice breathing room air and repeated in hypoxic/hypercapnic mice. Micro-CTA was performed within 20 seconds of intra-arterial contrast injection (220 μL/20 sec). Image quality of both methods was compared. Radiation dose measurements were performed with thermoluminescence dosimeters.

Results: Both methods provided high-resolution images of the murine cerebrovasculature, with the smallest identifiable vessel calibers of ≤ 50 μm. Due to its high temporal resolution of 30 fps, DSA allowed identification of anastomoses between the ICA and ECA by detection of retrograde flow within the superficial temporal artery. Micro-CTA during intra-arterial contrast injection resulted in a reduced injection volume and a higher contrast-to-noise ratio (19.0 ± 1.0) compared with DSA (10.0 ± 1.8) or micro-CTA when using an intravenous injection route (1.3 ± 0.4).

Conclusions: DSA of the murine cerebrovasculature is feasible using micro-CT and allows precise and repeated measurements of the vessel caliber, and changes of the vessel caliber, while providing relevant information on blood flow in vivo.


Figures

Fig 1.
Fig 1.
A, The micro-CT used for the experiments. B, A photograph of the inside of the lead-insulated cabin shows the multifocus x-ray source (S), the detector (D) beneath the x-ray source, as well as the manipulator table with the rotation axis. The height of the detector and the manipulator can be freely adjusted to optimize magnification levels that are affected by the SOD, SDD, and ODD. C, Polyethylene tubing used for intra-arterial injection of contrast agent into the external carotid artery of the mouse. To optimize the tubing system for insertion in small vessels like the ECA, the original tube (middle image; outer diameter 0.38 mm; inner diameter 0.23 mm) was tapered by applying traction to the heated tubing. The thinned polythene tube (lower image) fits well into the ECA. A matchstick (upper image) is shown for scale comparison. SOD indicates source-object distance; SDD, source-detector distance; ODD, object-detector distance.
Fig 2.
Fig 2.
Cerebral DSA of a C57BL/6J mouse (craniocaudal projection). DSA (4 fps) was performed during intra-arterial injection of a bolus of 33 μL of contrast agent within 1 second (1.980 mL/min) via the tapered polythene tubing system into the proximal ECA. The successive images show the early arterial phase (0.10 seconds and 0.35 seconds; A and B) and the parenchymal phase (0.60 seconds; C), while the veins already start to fill after 0.60 seconds (D–F). Despite ligation of the ECA during insertion of the catheter, the distal ECA and its branches are contrasted via a retrograde blood flow in the STA (white arrows in B and C) most probably via extracranial collaterals from the pterygopalatine artery. Relevant large vessels have been named to provide better orientation. PCA indicates posterior cerebral artery; OA, occipital artery; LA, lingual artery; FA, facial artery.
Fig 3.
Fig 3.
Cerebral DSA (30 fps) of a C57BL/6J mouse (lateral projection). High temporal and spatial resolution of the DSA again demonstrate retrograde filling of the proximally ligated ECA (A–C) via the distal and proximal rostral branch of the STA (direction of blood flow indicated by white arrows). With a slight delay, the occipital branch of the STA, as well as the FA and the LA arising from the ECA, are likewise contrasted (D). The retrograde filling occurs most likely via collaterals between the PPA and the STA. In the venous phase (E and F), the contrast of the STA diminishes from distal to proximal (once more indicating the retrograde flow), while the contrast of the FA and the LA fades away slightly later. The venous structures are shown in detail in Fig 6. FA indicates facial artery; LA, lingual artery; OA, occipital artery.
Fig 4.
Fig 4.
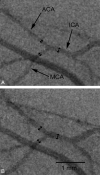
Repeated DSA demonstrates caliber changes of the cerebral vasculature in C57BL/6J mice. The caliber of the ICA, the MCA, and the ACA of each mouse were measured approximately 0.5 mm proximally (ICA) or distally (MCA, ACA) of the bifurcation of the ICA. A, DSA performed in a status of normocapnia with the animal breathing room air. B, After induction of hypoxic hypercapnia (5% CO2 and 12% O2 for 15 minutes), the cerebral vasculature is dilated.
Fig 5.
Fig 5.
Volume rendering of a micro-CT angiography of a C57BL/6J mouse. Due to the relatively short mean cerebral transit time (intra-arterial injection of 220 μL contrast media within 20 seconds scan time; 190° rotation; 600 projections; 80 kV; 75 μAs; voxel size: 39 × 29 × 29 μm) the venous and the arterial vessels are superimposed. A, Extracranial vessels: the ICA (dark green) and the PA (yellow) both draw into the base of the skull. The branches of the ECA are colored light green, and contrast despite proximal ligation via extracranial anastomoses, as shown in the previous DSA figures. B, Sagittal view showing the ICA running through the base of the skull. C, Cranial view of the skull base showing the intracranial arteries; a close-up shows the ICA drawing through the base of the skull (dark green), as well as the PCA (light green), the MCA (light red), and the ACA (light purple), which divides into the larger azygos ACA and a smaller branch providing blood supply for the olfactory brain (better seen in the overview). Furthermore, the PA (yellow) is shown drawing along the skull base (proximal part with thin bony coverage) and dividing into a lateral and a medial branch providing, among other things, blood supply for the eye and the nasal mucosa, respectively. PA indicates pterygopalatine artery; PCA, posterior cerebral artery.
Fig 6.
Fig 6.
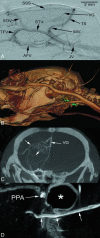
DSA (A, venous phase) and volume rendering of a micro-CT angiography (B), providing an overview over the intra- and extracranial venous structures. The SSS and the great cerebral vein or VG drain into the TS. The TS emerges from the cranium and is termed IMV before draining into the JV. The SOV and the TFV drain into the STV and then into the JV. The anterior facial vein drains into the JV more proximally (more clearly in micro-CT angiography images (B). C, A coronal section (maximum intensity projection of a micro-CT angiography) shows the blush of the choroid plexus (arrows) draining into the great VG. D, Micro-CT angiography offers sufficient resolution and contrast to depict intra-arterial pathologies. As an example, dissection of the ICA (arrows), ranging from the extra- into the intracranial segment is shown. The dissection also affects the PPA (*intraosseous part is shown in close proximity to the tympanic cavity). IMV indicates internal maxillary vein; JV, jugular vein; SOV, supraorbital vein; SSS, superior sagittal sinus; STV = superficial temporal vein; TFV, transversal facial vein; TS, transverse sinus; VG, vein of Galen.
Fig 7.
Fig 7.
In vivo DSA of the murine cerebrovasculature is feasible after injection of 100 μL Iomeprol (300 mg/L) within 1 second into the caval vein. A–C show original images acquired at 30 fps. In contrast to intra-arterial injection via the ECA, the complete circle of Willis is can be assessed. D, Improved image quality after integration of 6 single images.

References

    1. Barone FC, Knudsen DJ, Nelson AH, et al. . Mouse strain differences in susceptibility to cerebral ischemia are related to cerebral vascular anatomy. J Cereb Blood Flow Metab 1993; 13: 683– 92 - PubMed
    1. Zhang Z, Chopp M, Zhang RL, et al. . A mouse model of embolic focal cerebral ischemia. J Cereb Blood Flow Metab 1997; 17: 1081– 88 - PubMed
    1. Kim DE, Schellingerhout D, Jaffer FA, et al. . Near-infrared fluorescent imaging of cerebral thrombi and blood-brain barrier disruption in a mouse model of cerebral venous sinus thrombosis. J Cereb Blood Flow Metab 2005; 25: 226– 33 - PubMed
    1. Nagai M, Yilmaz CE, Kirchhofer D, et al. . Role of coagulation factors in cerebral venous sinus and cerebral microvascular thrombosis. Neurosurgery 2010; 66: 560– 65; discussion 565–66 - PMC - PubMed
    1. Sabri M, Jeon H, Ai J, et al. . Anterior circulation mouse model of subarachnoid hemorrhage. Brain Res 2009; 1295: 179– 85 - PubMed

Publication types

MeSH terms