

The effect of vocal fold adduction on the acoustic quality of phonation: ex vivo investigations
- PMID: 22578437
- PMCID: PMC3419787
- DOI: 10.1016/j.jvoice.2011.09.012
The effect of vocal fold adduction on the acoustic quality of phonation: ex vivo investigations
Abstract
Objectives: The purpose of this study was to investigate the effect of vocal fold adduction on voice quality in an ex vivo larynx model.
Study design: Prospective, repeated-measures experiments.
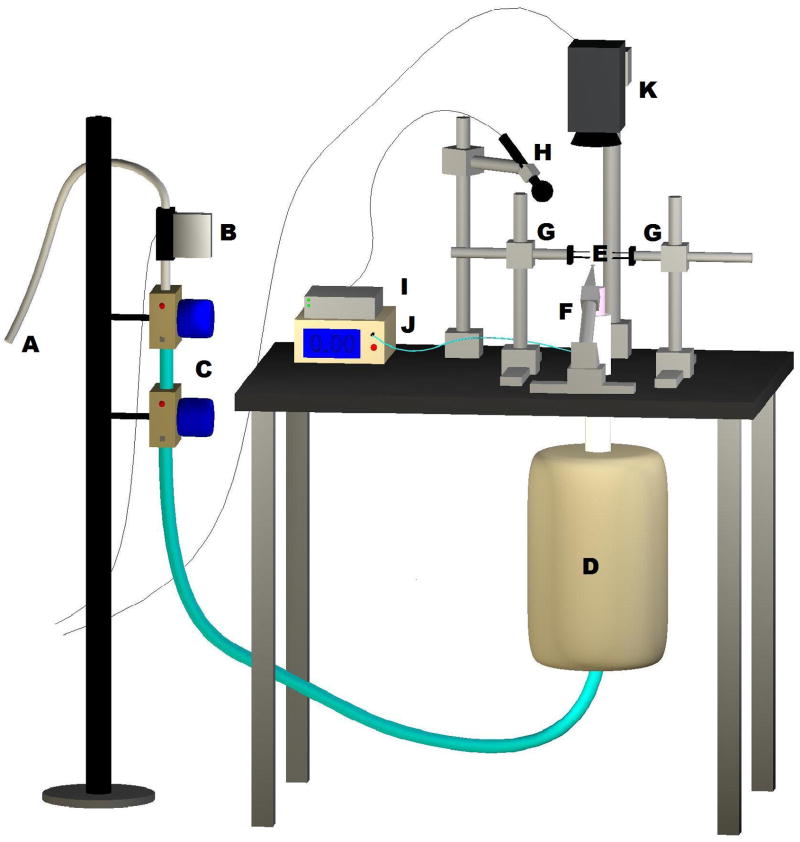
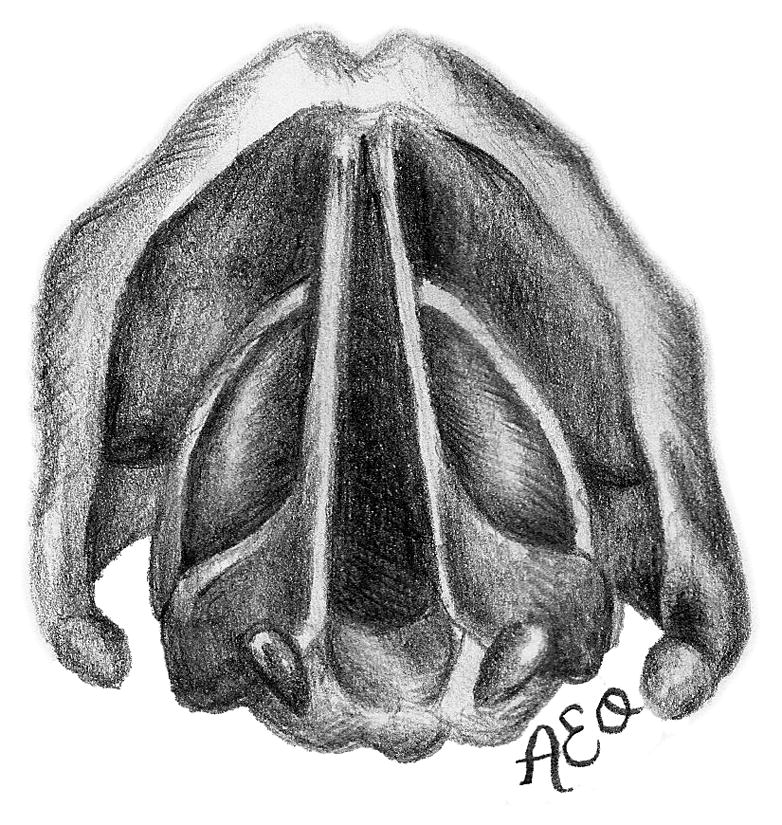
Methods: Ten excised canine larynges were mounted on an excised larynx phonation system and measurements were recorded for three different vocal fold adduction levels. Acoustic perturbation measurements of jitter, shimmer, and signal-to-noise ratio (SNR) were calculated from recorded radiated sound histories.
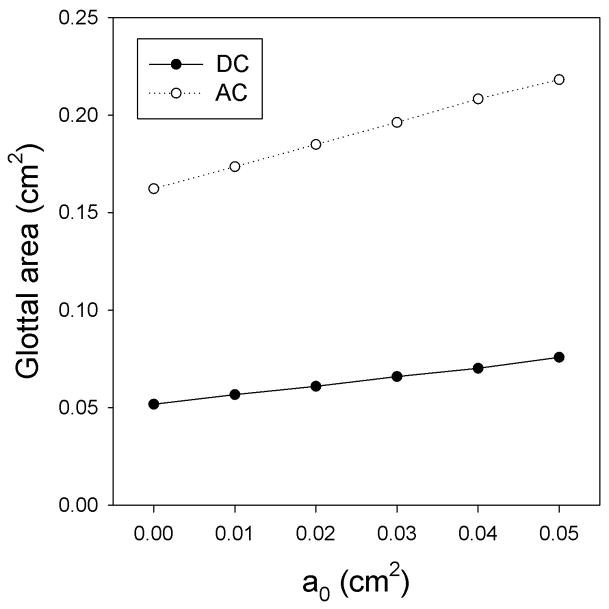
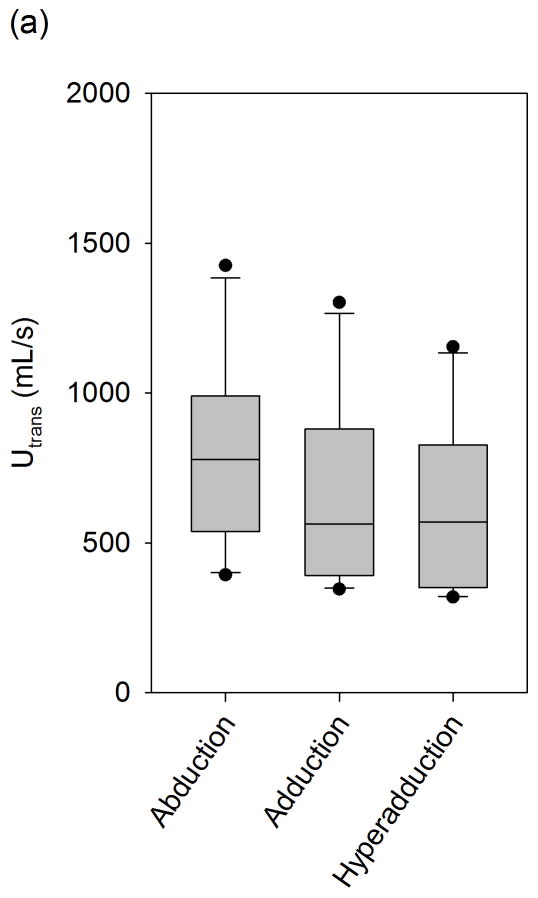
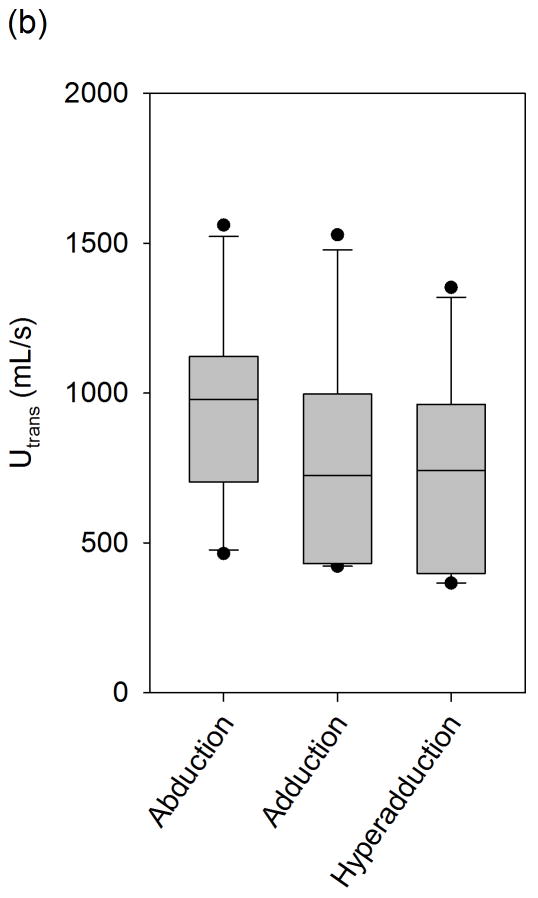
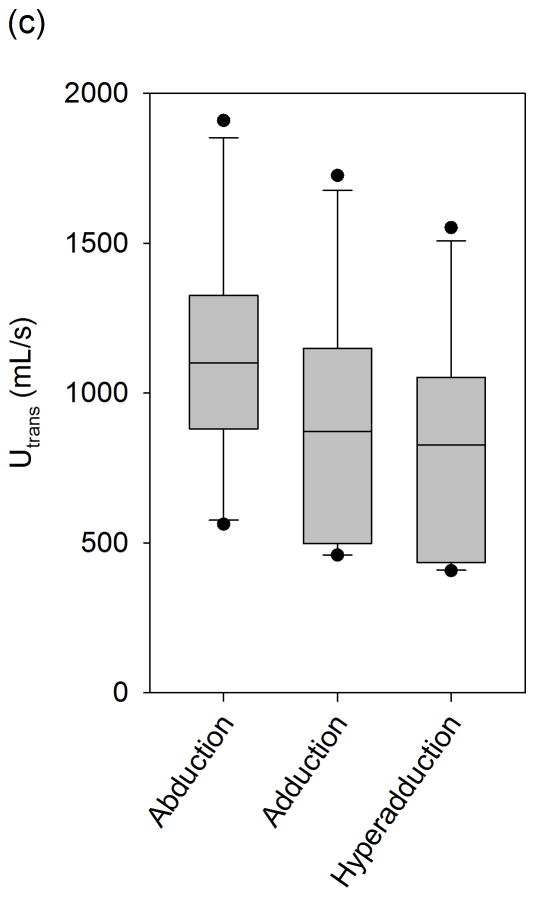
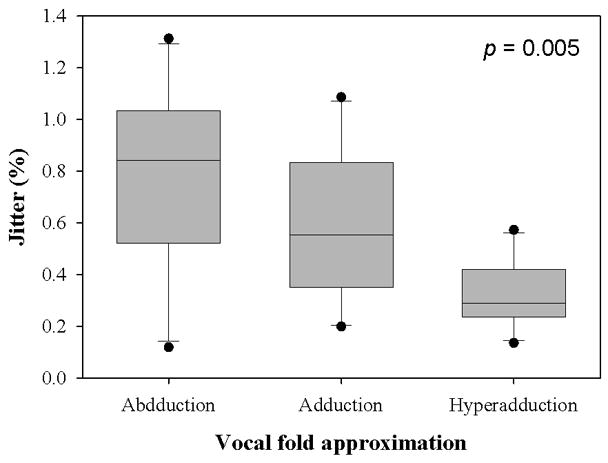
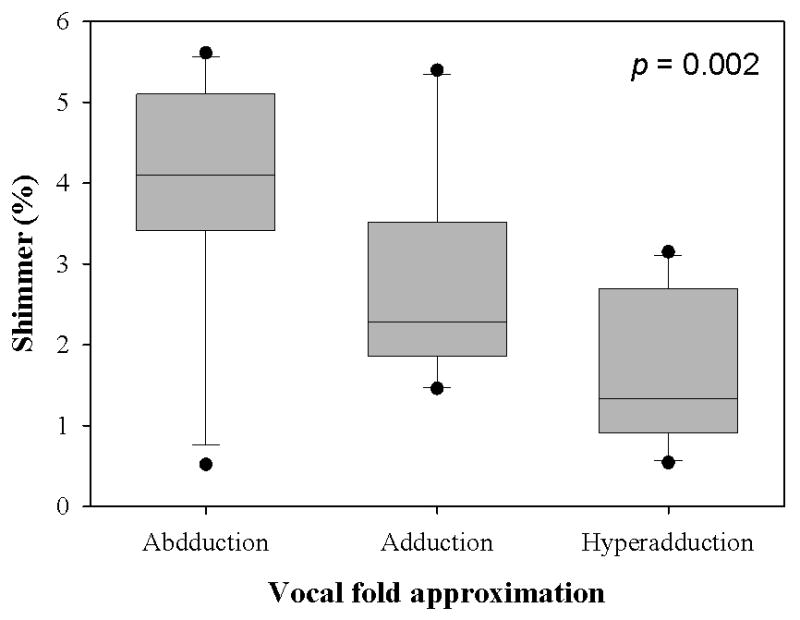
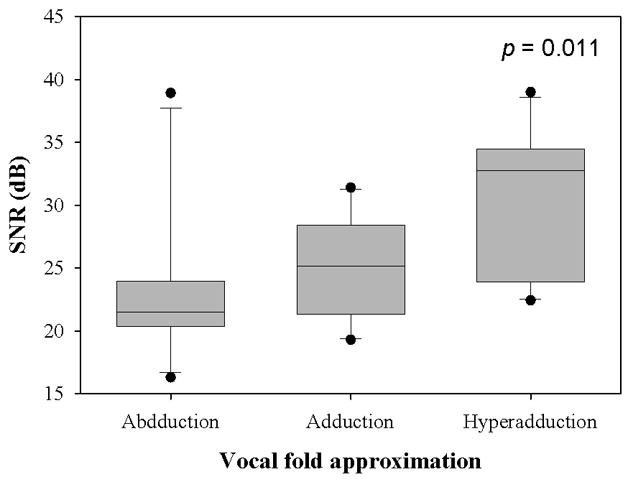
Results: Ex vivo experiments indicated that statistically significant increases in the means of jitter (P=0.005), shimmer (P=0.002), and SNR (P=0.011) measures decreased with respect to vocal fold adduction as the independent variable. Theoretical results showed that the direct current (DC) and alternating current (AC) component of glottal area increased monotonically with prephonatory glottal area.
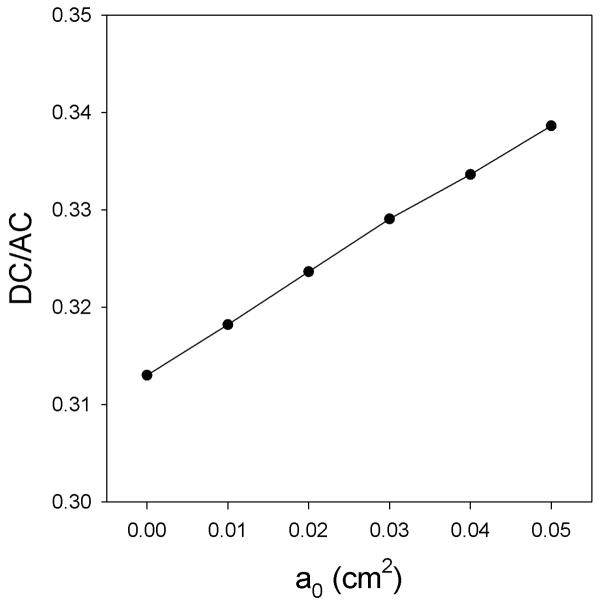
Conclusions: Acoustic perturbation increased with the degree of vocal fold abduction. Ex vivo larynx measurements suggested that a hyperadducted state may be acoustically best. This may be explained theoretically by an increase in DC/AC ratio as the prephonatory area is increased.
Copyright © 2012 The Voice Foundation. Published by Mosby, Inc. All rights reserved.
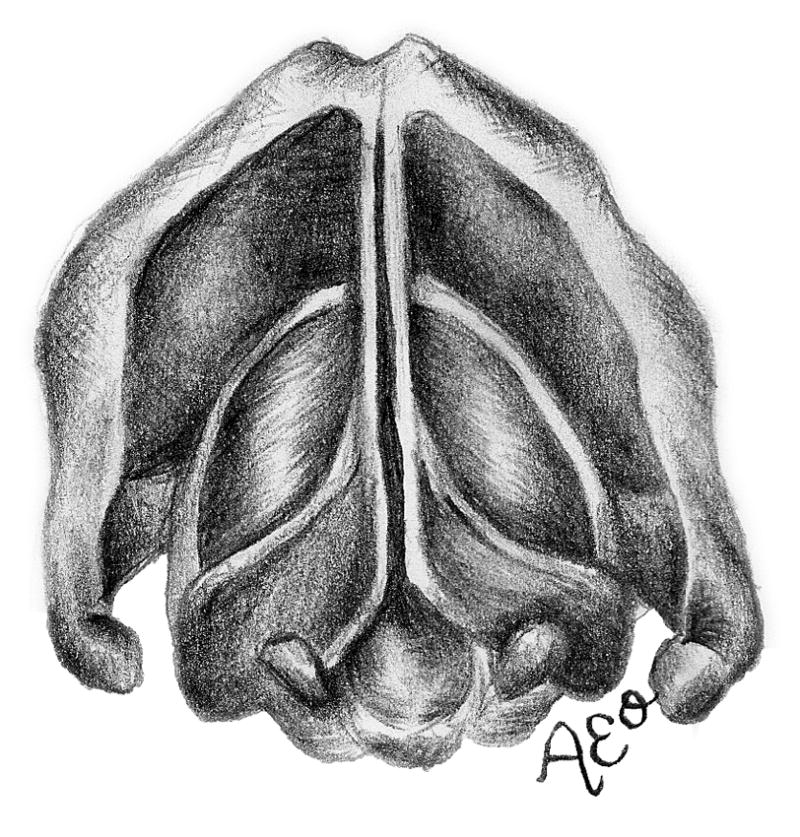
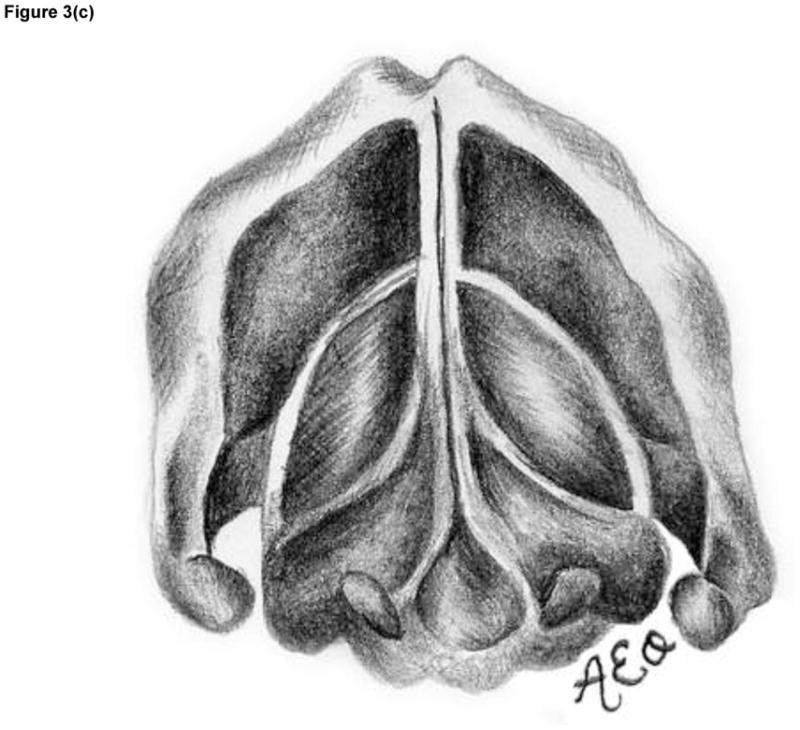
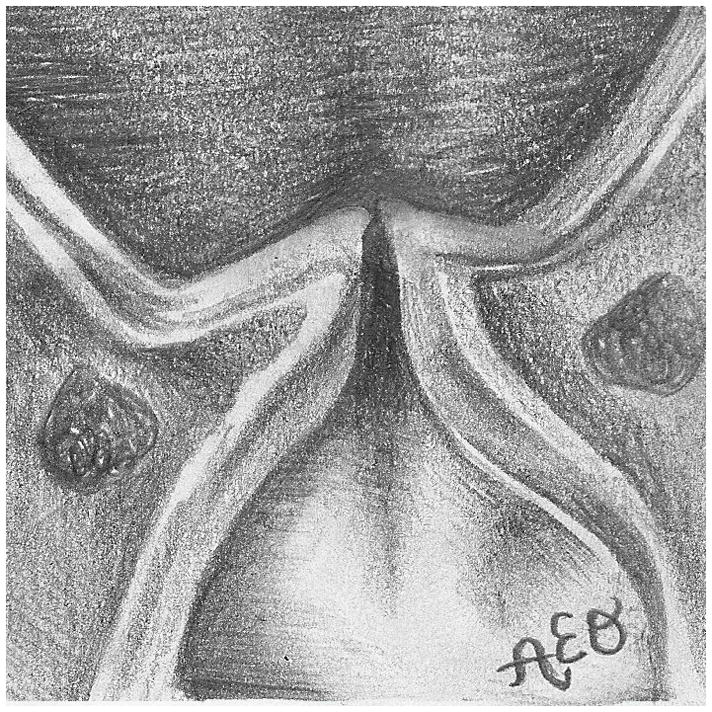
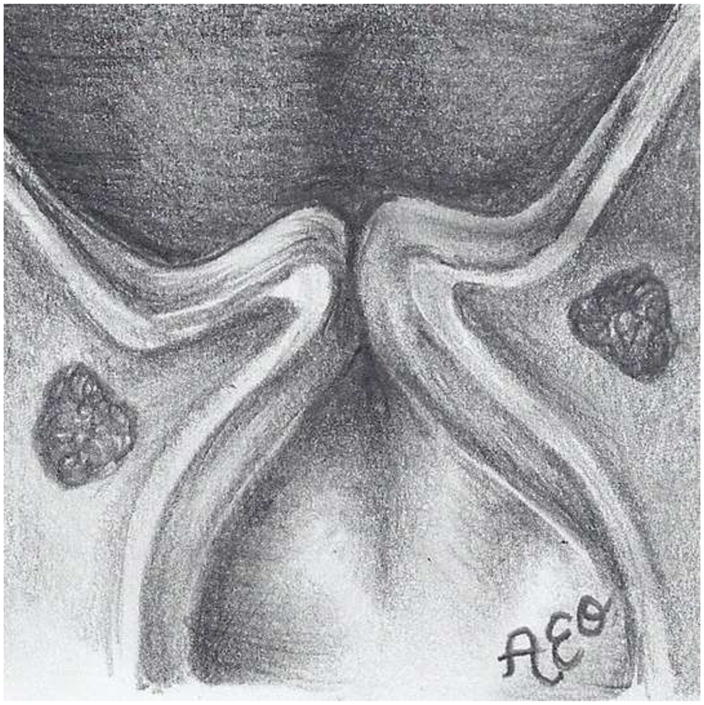
Figures

References
-
- Scherer RC, Titze IR. The abduction quotient related to voice quality. Journal of Voice. 1987;1:246–251.
-
- Grillo EU, Verdolini K. Evidence for distinguishing pressed, normal, resonant, and breathy voice qualities by laryngeal resistance and vocal efficiency in vocally trained subjects. J Voice. 2008;22:546–552. - PubMed
-
- Berry DA, Verdolini K, Montequin DW, Hess MM, Chan RW, Titze IR. A quantitative output-cost ratio in voice production. J Speech Lang Hear Res. 2001;44:29–37. - PubMed
-
- Alipour F, Scherer R, Finnegan E. Pressure-flow relationships during phonation as afunction of adduction. Journal of Voice. 1997;11:187–194. - PubMed
-
- Verdolini K, Druker DG, Palmer PM, Samawi H. Laryngeal adduction in resonant voice. J Voice. 1998;12:315–327. - PubMed
Publication types
MeSH terms
Grants and funding
LinkOut - more resources
Full Text Sources
