. 2012 May 25;149(5):1008-22.
doi: 10.1016/j.cell.2012.04.011. Epub 2012 May 10.

Enzymatic removal of ribonucleotides from DNA is essential for mammalian genome integrity and development

Affiliations

Enzymatic removal of ribonucleotides from DNA is essential for mammalian genome integrity and development

Martin A M Reijns et al. Cell. .

Abstract

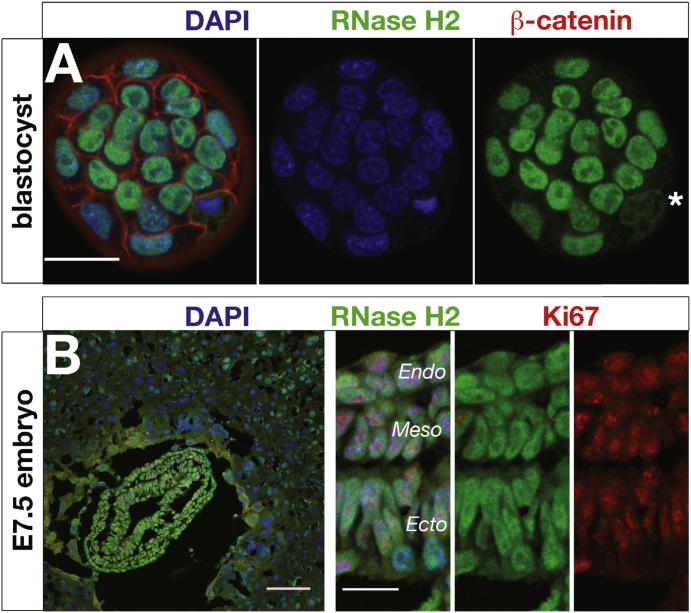
The presence of ribonucleotides in genomic DNA is undesirable given their increased susceptibility to hydrolysis. Ribonuclease (RNase) H enzymes that recognize and process such embedded ribonucleotides are present in all domains of life. However, in unicellular organisms such as budding yeast, they are not required for viability or even efficient cellular proliferation, while in humans, RNase H2 hypomorphic mutations cause the neuroinflammatory disorder Aicardi-Goutières syndrome. Here, we report that RNase H2 is an essential enzyme in mice, required for embryonic growth from gastrulation onward. RNase H2 null embryos accumulate large numbers of single (or di-) ribonucleotides embedded in their genomic DNA (>1,000,000 per cell), resulting in genome instability and a p53-dependent DNA-damage response. Our findings establish RNase H2 as a key mammalian genome surveillance enzyme required for ribonucleotide removal and demonstrate that ribonucleotides are the most commonly occurring endogenous nucleotide base lesion in replicating cells.


Figures

None
Graphical abstract
Figure 1
Figure 1
Targeted Inactivation of the Rnaseh2b Gene Causes Embryonic Lethality (A) Schematic depicting targeted mutagenesis of exon 7 of the Rnaseh2b gene. (Top) A 7 kb segment of the Rnaseh2b genomic locus; exons 6 (ex6) and 7 (ex7) are indicated by black boxes, flanked by EcoRI sites (R). (Middle) NotI (N)-SalI (S) restriction fragment of the final targeting construct, comprising 4.5 kb of genomic DNA and a Neomycin selection cassette (Neo) flanked by Cre recombinase loxP sites (triangles). (Bottom) Successfully targeted endogenous locus containing the mutagenized exon 7 (ex7). Red arrowheads indicate primers used to amplify arm I and arm II to confirm correct targeting. (B) Southern blotting and long-range PCR confirm successful targeting by homologous recombination. The introduction of an additional EcoRI site results in a restriction fragment of 4.1 kb detected on Southern blotting with the 400 bp probe (red bar in A) for the targeted ES cells (E202X/+) that is not present in parental DNA (+/+). Arm I (4.7 kb) and arm II (2.2 kb) fragments are amplified by PCR in correctly targeted ES cells only. (C) Sequencing traces for Rnaseh2b+/+, Rnaseh2bE202X/+, and Rnaseh2E202X/E202X DNA show the introduced nonsense mutation (red box). (D) Multiplex PCR for mouse genotyping. (Top) A 221 bp PCR product (a→c) is present in wild-type mice (+/+); mice containing the Rnaseh2bE202X allele (also) give a 460 bp product (a→b). (Bottom) Schematic indicating position of forward (a) and reverse primers (b and c). (E) Mice with null mutations (m) in Rnaseh2b are not postnatally viable, whereas E6.5–E10.5 embryos are present at Mendelian ratios. Genotype frequencies for offspring at weaning (and for embryos at indicated stages) derived from Rnaseh2bE202X/+ and RNaseh2btm1a/+ intercrosses respectively. p values, χ2 test; n.s., not significant; m, mutant allele. Rnaseh2b accession number: NM_026001.2.
Figure 2
Figure 2
Rnaseh2bE202X/E202X Embryos Exhibit Severe Growth Failure during Early Development, Resulting in Embryonic Lethality (A and B) Growth failure in mutant embryos starts at gastrulation. (A) Photomicrographs of representative embryos from embryonic stages E6.5, E7.5, E8.5, and E9.5. Scale bars, 200 μm. (B) There is a significant difference in length (L), width (W), and height (H) between wild-type (+/+) and mutant Rnaseh2bE202X/E202X embryos (denoted as −/−) at E7.5, but not at E6.5. (E7.5, 7 litters: n = 22,21,11; E6.5, 6 litters: n = 12,18,9 for +/+, +/−, and −/−, respectively). Error bars represent SEM; t test; n.s., not significant. (C) Immunoblotting demonstrates that all three RNase H2 subunits (RNASEH2A, B, and C) are absent from mutant embryo lysates. Loading control, actin. (D) Type 2 RNase H activity is undetectable in mutant embryos, and total cellular RNase H activity is reduced to < 10%. Cleavage of RNase H (RNA/DNA hybrid) and RNase H2-specific substrates by mutant and wild-type E9.5 embryo lysates was measured using fluorescence-based assays. Error bars represent SD. n = 3 replicates. See also Figure S1.
Figure 3
Figure 3
The RNase H2 Enzyme Is Expressed in Actively Proliferating Cells from Early Embryogenesis (A) RNase H2 is expressed from early embryogenesis. Whole-mount immunostaining of wild-type mouse blastocysts detects endogenous RNase H2 expression in the nucleus of interphase cells and dispersed throughout the cell at mitosis (). Scale bar, 20 μm. (B) RNase H2 is expressed in all three cell layers of gastrulating mouse embryos. Confocal image of a wild-type cryosectioned E7.5 embryo, with Ki67 marking actively proliferating cells. Scale bar, 100 μm. (Insert) Higher-power view demonstrates strong nuclear localization in all three embryonic layers: endoderm (Endo), mesoderm (Meso), and ectoderm (Ecto). Scale bar, 20 μm. See also Figure S2.
Figure 4
Figure 4
A p53-Dependent DNA-Damage Response Is Activated in RNase H2-Deficient Embryos, Leading to Arrest in Cellular Proliferation (A) Markedly elevated levels of nuclear pH2AX foci are evident in the epiblast of E6.5 embryos. Confocal projection of transverse cryosections through the decidua of E6.5 mutant RNaseH2null and control littermate embryos. Scale bar, 10 μm. (B and C) The number of S phase epiblast cells is reduced in E7.5 embryos. (B) Representative immunofluorescence confocal projections of 10 μm cryosections from E7.5 mutant and control embryos. Embryos fixed 1 hr after intraperitoneal injection of 100 mg/kg into pregnant females and EdU visualized by Click-iT (Invitrogen), counterstained with DAPI (blue). Scale bar, 50 μm. (C) Relative proportions of EdU- incorporating cells in E6.5 and E7.5 embryos demonstrate a significant reduction at E7.5 in RNaseH2null embryos (t test; n = 5 embryos per data point, >200 epiblast cells/embryo). S phase index determined from EdU-positive nuclei/total nuclei. Error bars represent SEM. (D) Significant upregulation of p53 target genes in E9.5 RNaseH2null embryos is detected by Illumina MouseWG-6 v2.0 Expression BeadChip microarray analysis. Plotted data points correspond to Illumina probes. (E) qPCR confirms a 6-fold upregulation of Cyclin G1 and p21 transcripts in E9.5 mutant embryos (error bars represent SD of technical triplicates). Immunoblotting of total cell lysates from E9.5 mutant embryos demonstrates increased p21 protein levels. Loading control, actin. (F and G) Cell-cycle arrest in RNaseH2null embryos is p53 dependent. (F) Growth kinetics from primary culture of mesenchymal cells recovered from E10.5 and E11.5 RNaseH2null embryos show that RNaseH2null cells from p53−/− (n = 5), but not p53+/− (n = 8) and p53+/+ (n = 2), littermates are capable of proliferation. Growth curves for Rnase2b+/+;p53−/− cells (n = 3) derived from littermates are shown for comparison. (G) Specific growth rates of MEFs calculated from growth kinetics as shown in (F). Rnase2b−/−;p53−/− cells initially grew with doubling times of 2.4 ± 0.4 days compared with Rnase2b+/+;p53−/− cells that doubled every 1.5 ± 0.5 days (p < 0.05). This difference became negligible at later passages (data not shown). Green circles correspond to MEF lines used for further analysis. See also Figure S3.
Figure 5
Figure 5
RNaseH2null Genomic DNA Is More Sensitive to Alkali Hydrolysis (A and B) Levels of pH2AX foci are elevated in Rnase2b−/−;p53−/− MEFs. (A) Representative immunofluorescent images of Rnaseh2b+/+, +/−, −/− cell lines. Scale bar, 10 μm. (B) Quantification for (A). Cells with five or more strong pH2AX foci. Error bars represent SD. n = 3 expts, > 100 cells/expt, t test. From here on +/+, +/−, −/−, and −/− indicate Rnaseh2b genotypes of four independent MEF lines. (C and D) Genomic DNA from RNaseH2null cells display markedly increased alkali sensitivity. (C) Representative gel of total nucleic acids from Rnaseh2b+/+, +/−, −/− MEFs and yolk sacs separated by alkaline agarose gel electrophoresis after alkaline hydrolysis. (D) Densitometry of the first five lanes of (C), plotted using Aida 2D densitometry software, demonstrates a substantial shift in migration of RNaseH2null MEF genomic DNA fragments. (E) Quantification of DNA fragmentation pattern calculated from densitometry traces shown in (D). Densitometry intensity distribution is divided by the fragment length distribution to quantitate the proportion of molecules of a particular fragment size. Fragment counts are normalized so that total nucleotide number is equal between samples. (F and G) Alkali treatment fragments RNaseH2null DNA to an average size that lies between 3.7 and 11 kb. (F) Fragmentation pattern of RNaseH2null (−/−) alkali-treated DNA compared with that of the nicking endonucleases Nt.BspQI, which cuts mouse genomic DNA on average every 11 kb (7-cutter), and Nb.BtsI, which cuts on average every 3.7 kb (6-cutter). (G) Densitometry of selected lanes from (F). See also Figure S4.
Figure 6
Figure 6
Covalently Incorporated Ribonucleotides Are Present in Nuclear DNA of RNaseH2null Cells (A–C) Rnase2b−/−;p53−/− genomic DNA contains mono or diribonucleotides. Total nucleic acids isolated from p53−/− MEFs were separated by agarose gel electrophoresis under native conditions or after denaturation with 90% formamide. (A) Genomic DNA from RNaseH2null cells does not contain elevated numbers of nicks. Increased nicking is detected only in genomic DNA treated with Nt.BspQI nicking endonuclease. (+/+, +/−, −/−,−/−) Rnaseh2b genotypes of four independent MEF lines. (B) RNase H2 fragments genomic DNA from RNaseH2null cells to the same extent as hydrolysis with NaOH. Total nucleic acids isolated from passage matched p53−/− MEFs ± Rnaseh2b treated with purified recombinant human RNase H2, catalytically inactive RNase H2 (RNASEH2A-D34A/D169A), or NaOH and were then denatured with 90% formamide. (C) Recombinant RNase HI, which cleaves DNA duplexes with three or more embedded ribonucleotides, does not fragment DNA from RNaseH2null MEFs. Treated nucleic acids were denatured with 90% formamide. (D–F) RNaseH2null cells have increased ribonucleotide incorporation, reflected by enhanced alkali sensitivity after low-dose hydroxyurea treatment. Alkali gel electrophoresis of total nucleic acids from four independent MEF cell lines with and without hydroxyuea (HU) treatment (200 μM for 48 hr). (E) Densitometry traces of selected lanes from (D) as indicated and (F) quantification of fragmentation pattern. See also Figure S5.
Figure 7
Figure 7
RNaseH2null Cells Display Large-Scale Genome Instability (A) Micronuclei are frequently present in Rnase2b−/−;p53−/− cells. Error bars represent SD. n = 3 expts 500–1000 cells/expt. p value, t test. (B) Chromosomal rearrangements (asterisk) and marker chromosomes (arrowheads) are evident in DAPI-stained metaphase chromosomes of Rnase2b−/−;p53−/− MEFs. (C and D) FISH for major (green) and minor (red) satellite probes confirms the presence of frequent intrachromosomal translocations and heterochromatic minutes (marker chromosomes). (i) Robertsonian translocation, (ii) heterochromatic marker chromosomes (arrowheads), (iii) end-to-end translocation, and (iv) complex chromosomal rearrangement. (D) Quantification of cytogenetic anomalies identified in (C). n = 38, 32, 33, and 20 metaphases, respectively. p < 0.05 (Fisher's exact test) for all wild-type (+/+) versus mutant (−/−) comparisons. See also Figure S6.
Figure S1
Figure S1
Full-Length Images of Immunoblots Probed with α-Rnase H2 Antibodies, Related to Figure 2 (A) Affinity purified antibodies raised against recombinant mouse RNase H2 detect RNASEH2A, RNASEH2B and RNASEH2C by immunoblotting. Lysates from wild-type (+/+) and Rnaseh2bE202X/E202X (−/−) E9.5 embryos were separated by SDS-PAGE alongside 0.1 pmol of purified recombinant mouse RNase H2. Recombinant RNASEH2B (RNASEH2B) migrates more slowly due to the presence of linker sequence. Loading control, GAPDH. (B and C) Full length immunoblots corresponding to those presented in Figure 2C. (B) RNASEH2B and RNASEH2C are detected in wild-type, but not in null embryo lysates. A long exposure image is provided to show that low levels of a truncated RNASEH2BE202X (predicted molecular weight, 23 kDa) are not apparent in RNaseh2null embryo lysates. (C) RNASEH2A was detected on the same blot, using a commercial anti-RNASEH2A antibody (Origene). Actin loading control shown in panel C also applies to the blots in panels B.
Figure S2
Figure S2
RNaseH2 Is Expressed in Actively Proliferating Cells during Development and Postnatally, Related to Figure 3 (A and B) RNase H2 expression is absent from RNaseH2null embryos as shown by whole-mount immunostaining of (A) blastocyst stage (E3.5) and (B) gastrulation stage (E7.5) embryos. Control embryo images were captured using the same microscopy settings as mutants. The panel from Figure 3B of an E7.5 control embryo is shown here for comparison. (C and D) RNase H2 expression is widespread in early embryos, but becomes more restricted as development advances. (C) RNase H2 remains ubiquitously expressed at E8.5. Somites (Som) and neural tube (NT). (D) However, by E13.5, higher level expression becomes restricted: widespread expression is seen in the dorsal epidermis (Epi) and dermis (Derm), whereas expression in underlying skeletal muscle and cartilaginous structures is greatly reduced. (E-H) RNase H2 is maintained in proliferative cell populations in the embryo and adult, and correlates with Ki67 expression. (E) Sagittal cryosections of dorsal telencephalon during neurogenesis at E13.5. The ventricular zone (VZ) and subventricular zone contain proliferating progenitor cells and recently generated neurons. Ventricle (V). (F) RNase H2 expression in P6 juvenile dorsal skin is localized to proliferating epidermal progenitors in anagen hair follicles, and the basal layer of interfollicular epidermis (data not shown). The rightmost panel additionally shows S-phase cells (white) marked by pulse labeling with EdU in a separate hair follicle. (G) In adult intestinal endothelium, RNase H2 expression also correlates with sites of proliferation, and is present in the crypts of Lieberkühn (CrLi), between the villi of the mucosa of the small intestine of a 5 month old adult mouse, while it is absent from the underlying submucosa (Sm). (H) RNase H2 is also expressed in the outer edges of seminiferous tubules containing cells undergoing spermatogenesis. RNase H2 is expressed in the least mature cells (spermatogonias or sperm stem cells, Sg) located at the base of the epithelium, with low levels of expression in more matured cells spermatocytes (Sc). No expression is detected in more differentiated spermatids (Sd) or the most mature cells, the spermatozoa (Sz), which are released in the lumen. Additionally, expression of RNase H2 is present at other sites with life-long proliferative populations, such as the stratum basale of the eosophagus, the thymus cortex and the spleen red pulp (the site of life-long hematopoiesis in the mouse) and germinal centers of the white pulp (data not shown). Scale bars A,C: 20 μm; F: 50 μm; B,D,E,G,H: 100 μm. (I) The RNase H2 enzyme complex is present at constant levels throughout the cell cycle. Total cell extracts from synchronized HeLa cells, harvested at indicated time points after release from 2 mM double thymidine block. Immunoblotting demonstrates constant levels of RNase H2 subunits at all time points. Loading control, actin. Bottom: Propidium Iodide FACS analysis to determine cell cycle stages. Probing with anti-phospho-histone H3 antibody (pH3) defines mitosis.
Figure S3
Figure S3
Partial Rescue of the RNaseH2null Mutant Phenotype in a p53−/− Background, Related to Figure 4 Embryo size was substantially rescued in all embryos analyzed at E9.5 (7/7) relative to previously analyzed RNaseH2null embryos. At E10.5, 3 out of 4 Rnaseh2b−/−;p53−/− embryos were also much larger than Rnaseh2b−/−;p53+/+ mutants but not as large as littermate controls. Measurement of E9.5 embryos confirmed that growth was not completely rescued: crown-rump length Rnaseh2b−/−;p53−/− 1.76 ± 0.44 mm (SD; n = 7), Rnaseh2b+/;p53−/− 2.33 ± 0.47 mm (SD; n = 10; t test, p = 0.02). Images shown: E10.5 (i) Rnaseh2b−/−;p53+/+ (ii) Rnaseh2b−/−;p53−/− (iii, iv) littermate control embryos for i and ii respectively (scale bars, 500 μm). A morphological rescue of the RNaseH2null phenotype was observed at E9.5 and E10.5: Rnaseh2b−/−;p53−/− mutants were not developmentally retarded and did not exhibit truncation, somite or allantoic defects (n = 11). Total embryos analyzed: E9.5 n = 33; E10.5 n = 66. The previously described partially penetrant embryonic p53−/− phenotype was present in some p53−/− embryos with defects in neural-tube closure evident (Armstrong et al., 1995; Sah et al., 1995). Some background abnormalities were also evident in Rnaseh2b+/;p53+/ control littermate embryos (e.g., 11% exhibited severe runting at E10.5). Given the partial phenotypic rescue in growth, along with the marked genome instability observed in Rnaseh2b−/−;p53−/− MEFs, it would appear unlikely that these double mutant embryos will be viable at later embryonic stages, as has also been the case for previously reported DNA damage mutants crossed onto a p53−/− background (Adam et al., 2007; Bouwman et al., 2011; Hakem et al., 1997).
Figure S4
Figure S4
RNase H2 Is Absent from Rnaseh2b−/−;p53−/− MEFs; Quantitative Estimation of Ribonucleotide Levels in Genomic DNA, Related to Figure 5 (A) All three RNase H2 subunits are absent from MEFs derived from Rnaseh2b−/−;p53−/− embryos, as shown by immunoblotting. Loading control, Actin. (B) Whereas RNase H2 activity is reduced in Rnaseh2b+/−;p53−/− MEFs (+/−), substrate cleavage is not detected in two independent Rnaseh2b−/−;p53−/− lines (−/−), within the sensitivity of the assay. Error bars represent SEM of technical triplicates. (C) PolyADPribosylation is increased in RNaseH2null MEFs. Immunoblot probed with α-PAR antibody. PolyADPribosylation occurs on a large number of proteins in response to DNA damage, but auto-PARylation of PARP1 predominates (Satoh and Lindahl, 1992). ‘+/+, +/−, −/− and −/−’ correspond to 4 independent MEF cell lines. ‘+HU’, RNaseh2b+/+ MEFs treated with 300 μM hydroxyurea for 48 hr as a positive control. Immunoblot representative of 4 independent experiments. Densitometry of immunoblots confirmed that compared to the +/+ control polyADPribosylation was significantly increased in both −/− lines (n = 4, paired t test, p < 0.05 and p = 0.001 respectively for −/− lines; for the ‘+/−’ line, the p-value was not significant). (D) Untreated total nucleic acids purified from MEFs and yolk sacks (E9.5 or E10.5) separated by agarose gel electrophoresis. (E) Genomic DNA from E9.5 RNaseH2null yolk sacks is cleaved by RNase H2, but not RNase HI, showing accumulation of incorporated mono or di-ribonucleotides. Treated nucleic acids were denatured in 90% formamide and separated by agarose gel electrophoresis. (F) Quantification of ribonucleotide incorporation rates: estimation by analytical methodology and simulation studies. (i-iii) Gel background intensity was uniformly subtracted from all raw densitometry distributions of electrophoresed alkali-digested genomic DNA (i). The distributions were transformed to nucleotide size (iii) on the basis of a DNA calibration curve derived from size standard ladders (ii) and a spline with 40 degrees of freedom used to produce a smoothed distribution. (iv) Analytical estimate: Histograms of fragment counts per nucleotide length were fitted to the smoothed distributions. These were modeled on the basis of a linear relationship between staining intensity and nucleotide content. Nucleotide number was scaled to 109 per distribution. From these resulting histograms (iv) an analytical estimate for additional fragmentation in mutant (‘−/−’, orange) versus control DNA (here, ‘+/−’, blue) was obtained, by subtracting fragment count of control from that of mutant. Overall, this resulted in an estimate of 1 ribonucleotide every 7,600 nucleotides in RNaseH2null MEFs (1 in 7.6 ± 0.8 kb; SD, n = 4, biological replicates compared to +/+ and +/− controls). Transforming the x axis to a log scale (v) allows the fragment count distributions to be viewed as areas under the curve, the excess area of the −/− relative to the +/− curve is proportional to the number of additional fragments the Rnaseh2b−/− genome is hydrolyzed into, as also shown in Figures 5E and 6F. (vi) To explore the spatial distribution of incorporated ribonucleotides, a simulation study was performed in which the control distribution (solid blue) was transformed by random fragmentation, and a best-fit (dotted green) to the mutant distribution (solid orange) obtained. This simulation was broadly consistent with cleavage at random positions, however given that the fit is not exact it remains conceivable that ribonucleotide incorporation is in part non-random. The random cut simulation provided a frequency estimate of 1 in 6,100 nucleotides. The analytic estimate of 1 in 7.6 ± 0.8 kb (SD) is supported by experimental results that showed a site frequency between 1 in 3.7 and 11 kb (Figure 5F, G and Figure S4H) and a similar simulation result. As the mouse haploid genome contains ∼2.5x10⁹ bp (Waterston et al., 2002), each diploid nucleus contains 1010 nucleotides of DNA. Thus with a ribonucleotide frequency of 1 in 7.6 kb; in excess of 1.3 million ribonucleotide sites would be expected per replicating cell in the absence of RNase H2 activity. (G) Quantification of DNA fragmentation pattern calculated from densitometry traces shown in Figure 5G. Fragment counts normalized so that total nucleotide number is equal between samples.
Figure S5
Figure S5
E. coli RNase HI Cleaves Substrates with Three or More Embedded Ribonucleotides; Increased Ribonucleotide Incorporation after Hydroxyurea Treatment, Related to Figure 6 (A) Substrate (5 pmol) with 4 ribonucleotides embedded in a 40 bp DNA duplex (D18R4D18/D40) was incubated for 5 min (or 1 hr where indicated) at 37°C with E. coli RNase HI (NEB) in the absence or presence of 0.5 μg of RNaseH2null nucleic acids, and separated by denaturing PAGE. (B) RNaseH2null genomic DNA in the same reactions as panel A (1 hr incubations), is not cleaved by RNase HI, but is hydrolyzed by RNase H2 or alkaline treatment (agarose gel electrophoresis after formamide denaturation to resolve high molecular weight nucleic acids). (C) As panel A: a substrate with 3 embedded ribonucleotides (D19R3D18/D40) is completely cleaved by RNase HI. (D) Substrates with 2 (D19R2D19/D40) or 1 (D21R1D18/D40) embedded ribonucleotides were not cleaved by RNase HI, when incubated for 1 hr with E. coli RNase HI (NEB). Complete hydrolysis of the ribonucleotide containing strand of the substrate in A, C and D was achieved by heating in the presence of NaOH. (E and F) Hydroxyurea treatment to deplete cellular dNTPs, increases ribonucleotide incorporation by replicative polymerases in RnaseH2null cells. Nucleic acids from untreated and HU-treated MEF cell lines. ‘+/+, +/−, −/− and −/−’ indicate Rnaseh2b genotypes of four independent MEF lines. RNase H2 treated total nucleic acids were denatured in formamide and separated by agarose gel electrophoresis. Co-treatment with RNase A was used to remove ribosomal RNA bands. Treatment of RNaseH2null DNA (−/−) by RNase HI and/or formamide denaturation had no effect on fragmentation pattern (data not shown). (F) Densitometry of selected lanes from panel E. (G) RNaseH2null cells are hypersensitive to low dose HU treatment with marked accumulation of cells in S phase. Propidium iodide FACS profiles. DNA content (x axis) plotted against cell number. Data shown: one representative experiment of 4 performed. (H) While using mitochondrial DNA as a control in our experiments (given its known alkali sensitivity), we made the observation that wild-type mitochondrial DNA, isolated from sucrose-gradient purified mouse liver mitochondria, can be fragmented by recombinant RNase H2 to a similar extent as by alkaline hydrolysis, but is not detectably cleaved by RNase HI. This is consistent with the accumulation of single (or double) ribonucleotides, indicating that for mitochondrial DNA ribonucleotide incorporation can be tolerated in a physiological context.
Figure S6
Figure S6
Chromosomal Abnormalities in RNaseH2null Cells; A Model for Ribonucleotide Accumulation in RNaseH2null Genomic DNA and Double-Strand Break Formation, Related to Figure 7 (A) Chromosome painting confirms the presence of cytogenetic rearrangements in RNaseH2null MEFs. Image of metaphase with chromosome 4 paint showing a reciprocal translocation (arrow heads) and 3 intact copies of chromosome 4. (B) Quantification of abnormalities in chromosome 4, from metaphase chromosome painting. n = 46, 43, 46 and 48 metaphases respectively. (C and D) Model: Ribonucleotide accumulation in genomic DNA and double strand break formation (C) Ribonucleotides (R) are incorporated into genomic DNA by replicative polymerases (Pol δ, ɛ). RNase H2 initiates the removal of such nucleotides, a process that is likely to also involve FEN1 to generate a gap that is then repaired by a DNA polymerase and ligase. (D) In the absence of RNase H2 ribonucleotides accumulate on both DNA strands. Such ribonucleotides may cause replication fork stalling when clustered or when present in difficult to replicate genomic regions, leading to DNA damage response activation and proliferation arrest. Replication fork collapse could then lead to double strand break formation. Alternatively hydrolysis of directly opposed ribonucleotides may lead to double strand breaks, perhaps when processed by alternative mechanisms. Notably Topoisomerase I has appropriate site-specific ribonuclease activity to participate in such an alternative repair pathway (Kim et al., 2011; Sekiguchi and Shuman, 1997). ∼50 sites per RNaseH2null cell where ribonucleotides are directly opposed would be expected, assuming a random distribution of ribonucleotides in genomic DNA.

References

    1. Alberts B., Johnson A., Lewis J., Raff M., Roberts K., Walter P. Garland Science Taylor & Francis Group; New York: 2002. Molecular biology of the Cell.
    1. Arudchandran A., Cerritelli S., Narimatsu S., Itaya M., Shin D.Y., Shimada Y., Crouch R.J. The absence of ribonuclease H1 or H2 alters the sensitivity of Saccharomyces cerevisiae to hydroxyurea, caffeine and ethyl methanesulphonate: implications for roles of RNases H in DNA replication and repair. Genes Cells. 2000;5:789–802. - PubMed
    1. Belyi V.A., Ak P., Markert E., Wang H., Hu W., Puzio-Kuter A., Levine A.J. The origins and evolution of the p53 family of genes. Cold Spring Harb. Perspect. Biol. 2010;2:a001198. - PMC - PubMed
    1. Bhoj V.G., Chen Z.J. Linking retroelements to autoimmunity. Cell. 2008;134:569–571. - PubMed
    1. Bogenhagen D., Clayton D.A. Mouse L cell mitochondrial DNA molecules are selected randomly for replication throughout the cell cycle. Cell. 1977;11:719–727. - PubMed

Supplemental References

    1. Adam, J., Deans, B., and Thacker, J. (2007). A role for Xrcc2 in the early stages of mouse development. DNA Repair (Amst.) 6, 224–234. - PubMed
    1. Armstrong, J.F., Kaufman, M.H., Harrison, D.J., and Clarke, A.R. (1995). High-frequency developmental abnormalities in p53-deficient mice. Curr. Biol. 5, 931–936. - PubMed
    1. Bouwman, P., Drost, R., Klijn, C., Pieterse, M., van der Gulden, H., Song, J.Y., Szuhai, K., and Jonkers, J. (2011). Loss of p53 partially rescues embryonic development of Palb2 knockout mice but does not foster haploinsufficiency of Palb2 in tumour suppression. J. Pathol. 224, 10–21. - PubMed
    1. Dunning, M.J., Smith, M.L., Ritchie, M.E., and Tavaré, S. (2007). beadarray: R classes and methods for Illumina bead-based data. Bioinformatics 23, 2183–2184. - PubMed
    1. Hakem, R., de la Pompa, J.L., Elia, A., Potter, J., and Mak, T.W. (1997). Partial rescue of Brca1 (5-6) early embryonic lethality by p53 or p21 null mutation. Nat. Genet. 16, 298–302. - PubMed

Publication types

Associated data