. 2012 Jun 22;149(7):1607-21.
doi: 10.1016/j.cell.2012.04.012. Epub 2012 May 10.

Three-dimensional structures of membrane proteins from genomic sequencing

Affiliations

Three-dimensional structures of membrane proteins from genomic sequencing

Thomas A Hopf et al. Cell. .

Abstract

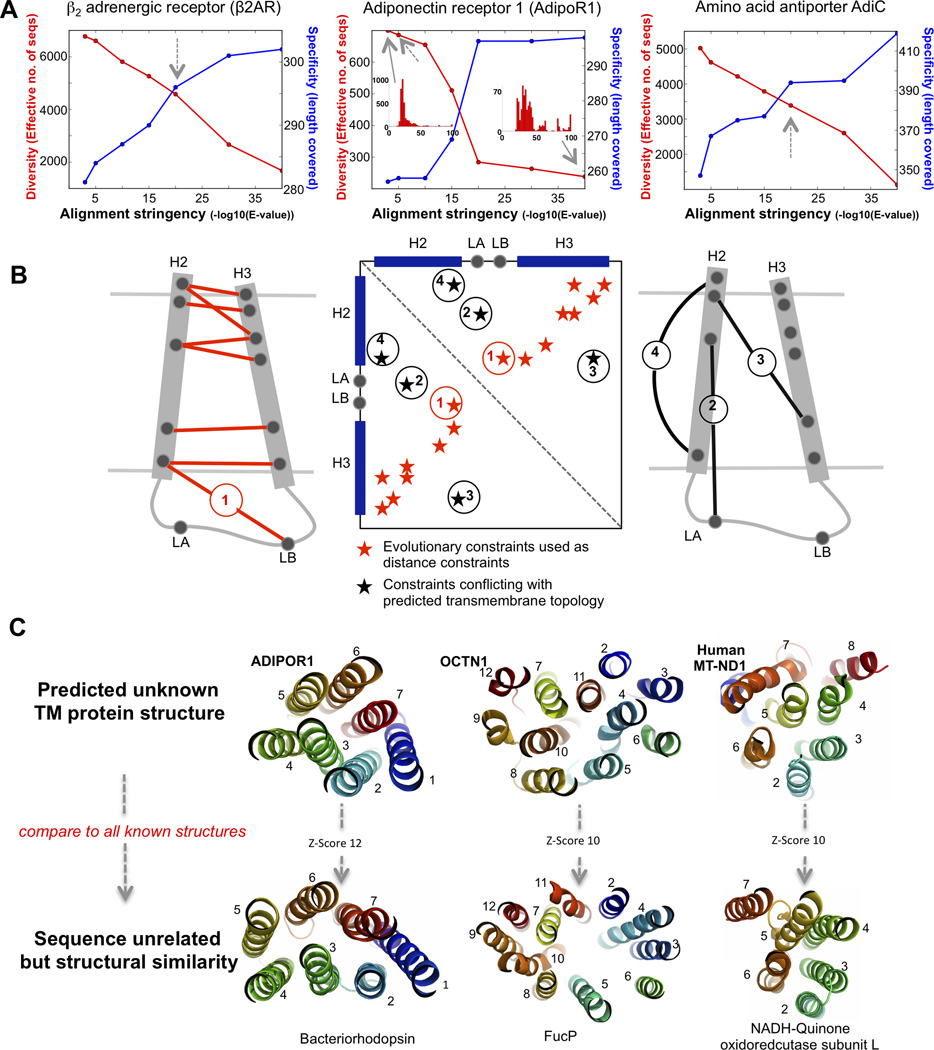
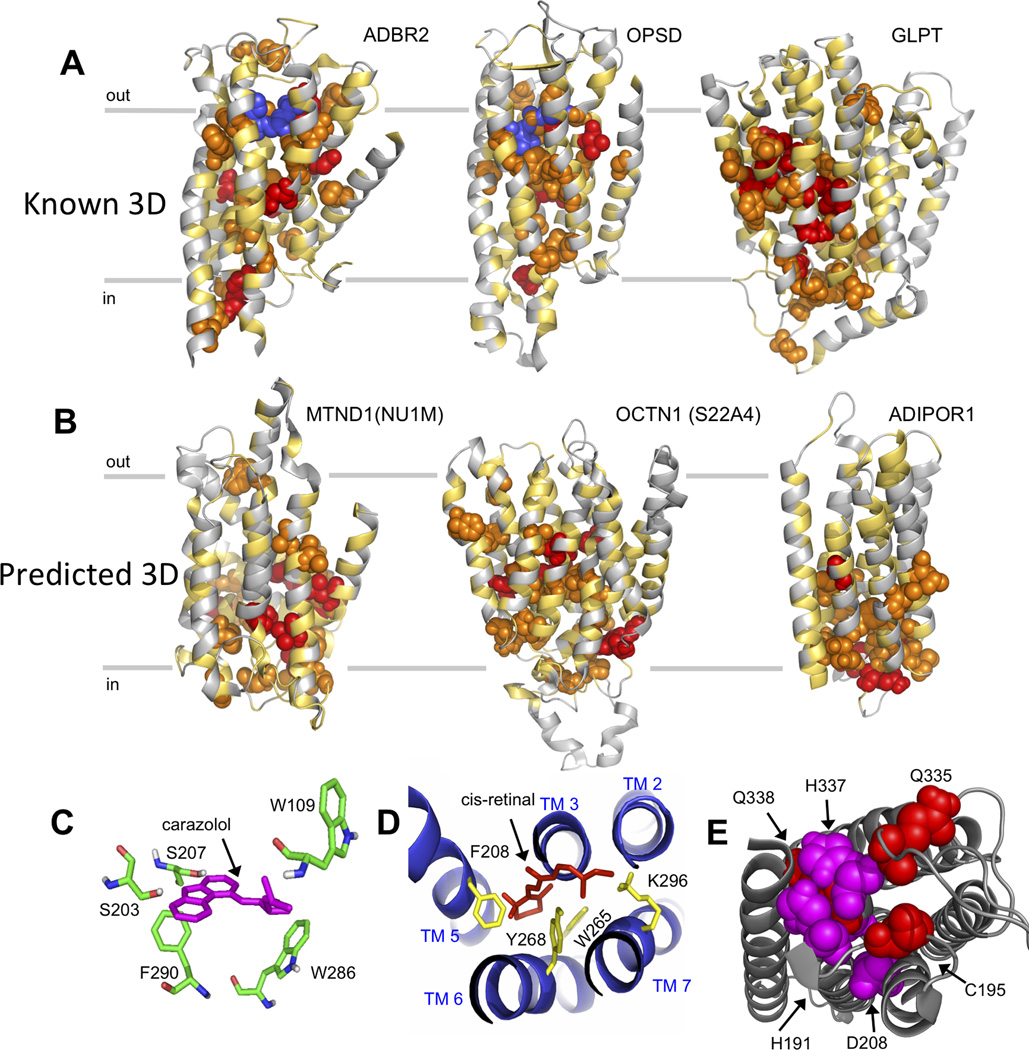
We show that amino acid covariation in proteins, extracted from the evolutionary sequence record, can be used to fold transmembrane proteins. We use this technique to predict previously unknown 3D structures for 11 transmembrane proteins (with up to 14 helices) from their sequences alone. The prediction method (EVfold_membrane) applies a maximum entropy approach to infer evolutionary covariation in pairs of sequence positions within a protein family and then generates all-atom models with the derived pairwise distance constraints. We benchmark the approach with blinded de novo computation of known transmembrane protein structures from 23 families, demonstrating unprecedented accuracy of the method for large transmembrane proteins. We show how the method can predict oligomerization, functional sites, and conformational changes in transmembrane proteins. With the rapid rise in large-scale sequencing, more accurate and more comprehensive information on evolutionary constraints can be decoded from genetic variation, greatly expanding the repertoire of transmembrane proteins amenable to modeling by this method.


Figures

Figure 1
Figure 1. De novo predicted 3D models of membrane proteins with no known structure (related to Figure S1)
Cartoon shows evolutionary couplings as calculated by EVfold – membrane placed as distance constraints on extended polypeptide before folding. Top ranked models of a representative set of 6 transmembrane proteins from diverse families, which have no members with known 3D structures. Models are cartoon representation with rainbow coloring blue N terminal to red C terminal, seen from the side (left) and non-cytoplasmic side (right). Naming conventions, 3D coordinates and input files in Tables 1, S1 Data S1, Data S2–5.
Figure 2
Figure 2. From sequence alignment to folded structures. (Related to Figure S2)
A. Building the alignment for the EC calculation for the specific query protein requires a trade-off between specificity and diversity. To investigate this blindly, we scan a range of alignment depths using different expectation values, calculate the effective number of sequences returned (diversity) and the number of residues in our query protein sequence which do not have more than 30% gaps in the alignment column of the alignment (coverage); Dashed arrows point to chosen stringency for folding. Contrast in the distribution of sequence space at different alignment depths in histograms of the range of number of sequences with the 0–100 % identity to query protein sequence (Insets, middle panel) (related to Figure S2). B. Schematic showing constraint conflict resolution between predicted co-evolution and predicted secondary structure/membrane topology. In all cases we follow the predicted membrane topology and discard co-evolving residue pairs that conflict with this prediction. The predicted toy contact map (middle panel), shows evolutionary constraints that conflict with the predicted membrane topology that are removed (black stars). evolutionary constraints that do not conflict with the predicted membrane topology are not removed, irrespective of any knowledge about their distance in 3D space (constraint 1) C. The top ranked model from the set of each de novo predicted structures was compared to the entire PDB using the structural alignment program DALI (Holm and Sander, 1995). 3 of the 6 predicted 3D TM protein structures with significant structural similarities to known transmembrane protein folds are shown.
Figure 3
Figure 3. Accuracy of blinded 3D structure prediction for candidates with known structure. (Related to Figure S3, Figure S4)
A. Structural superpositions of predicted structures (blue) onto experimental structures (grey). First panel for each protein: side view from within the membrane; second panel: top-down view from non-cytoplasmic side. All figures rendered with PyMOL. B. Accuracy of 3D structure prediction for candidates with known structure: Template modeling score (TM score) (Zhang and Skolnick, 2004) of the best model for each protein plotted against the number of sequences in the multiple sequence alignment, normalized by modeled protein length C. 3D prediction accuracy is surprisingly stable as the true positive rate of evolutionary constraints decreases, going down the list of ranked EC's. The TM score of the best prediction (blue) and the true positive rate (red) are plotted for increasing numbers of evolutionary constraints (divided by the number of residues in the protein to allow comparison between proteins). Distance cutoffs to define true contacts of true positive rate are 5Å (red dots), 7Å (red dashes) and 8Å (red) (Figure S3, Figure S4 and Data S2–5)
Figure 4
Figure 4. Evolutionary constraints on residue pairs in oligomerization interfaces. (Related to Figure S5)
Contact maps of top ranked predicted EC's (red stars in A and B) overlaid on crystal structure contacts (grey, known only in A). Residue pairs coevolving due to inter-monomer contacts in the homo-oligomer (black circles) in an overlay of top ranked predicted evolutionary constraints (red) experimental structure contacts (grey), where known, on contact maps for each protein. In the monomer (blue or green ribbon with blue or green residue balls), the corresponding residue pairs would be false positive contacts (blue with blue or green with green do not make contact in the monomer), but would be true positives in the homo-oligomer structure (contacting blue-green pairs). A. Four examples of inference of oligomer contacts from EC's of known 3D structures (also Figure S5). B. Predicted dimer contacts of AdipoR1, shown on predicted monomer structures. EC pairs (black circles) at a large distance in monomer structure (~ 23A, green with green, blue with blue) are close (green-blue contact pair) in predicted dimers. Predicted dimer cartoon (right) is a rough estimate, produced by manual-visual docking of monomers, satisfying the majority of predicted dimer interface EC pairs (middle panel).
Figure 5
Figure 5. Co-evolved pairs consistent with open and closed conformations of proteins in the major facilitator family. (Related to Table S3)
A. Center panel: contact map for E. coli GlpT, residues less than 5Å apart in the crystal structure (grey circles, PDB:1pw4) overlaid with the top 350 EC's (red stars). The similarity of the upper left and lower right quadrants reflect the similarity of the structure and sequences of the two domains. Upper right and lower left quadrants show the predicted inter-domain contacts (all stars). Stripes in lower left and upper right quadrants cover inter-domain contacts involving the periplasmic end of the helices/loops (green strips, lower left) and the cytoplasmic ends of the helices/loops (blue strips, upper right). Predicted EC's located where stripes of the same colour cross each are likely inter-domain contacts, green and blue stars (Table S3). Right and left bottom panels: Refolded GlpT from extended polypeptide excluding blue constraints for cytoplasmic side open (right), and excluding green constraints for cytoplasmic side closed (left). The schematics (right and left top) indicate contacts used (arrows) and not used (scissors) in re-folding to get the two alternative conformations. Open conformation (right) is similar to crystal structure (Table 1) and is reproduced via re-folding, closed conformation structure (left) is previously unknown and predicted here via re-folding. B. Details from the models in A: the two pairs of helices (H5/8 and H2/11) in the predicted models of GlpT are thought to change conformation dependent on state of substrate binding (closed at cytoplasm, green ribbons, left; open at cytoplasm, blue ribbons, right). Differences in interhelical angles are driven by the alternative use of top (green) or bottom (blue) contact pairs derived from EC's in re-folding (Table S3). C. Predicted EC pairs of human OCTN1 (red stars on contact map) determine the overall fold. Stripes in lower left and upper right quadrants cover the predicted periplasmic end of the helices/loops (green) and the cytoplasmic ends of the helices/loops (blue). Predicted evolutionary constraints (not differentiated by star color) located where stripes of the same colour cross each other are predicted inter-domain contacts. 3D structures of alternative conformations of OCTN1 not shown here. Predicted OCTN1 structure details see Figure 1, Table 1 and Data S2.
Figure 6
Figure 6. Known functional sites contain residues strongly involved in evolutionary constraints. (Related to Table S4)
A, B. The total evolutionary coupling score on individual residues reflects likely functional involvement (top 5% (red spheres), top 6–15% (orange spheres), all others (yellow ribbon)); scores as in Table S4. A. The ligands carazolol in Adrb2 and retinal in OPSD (blue spheres) were positioned in the predicted structure by globally superimposing the most accurate predicted model and the experimental structure plus ligand (experimental structures not shown, no docking was performed). B. Residues with high evolutionary coupling scores mapped on the predicted structures of unknown-structure transmembrane proteins. C,D. Above average accuracy of blinded prediction of atomic positions of the binding site of Adrb2 (1.6 Å Cα-rmsd over 9 residues, C) and bovine rhodopsin (1.8Å Cα-rmsd over 10 residues, D). E. Likely functional residues (high evolutionary coupling scores) in AdipoR1 on the predicted cytoplasmic side (known functional residues in magenta, predicted functional residues in red).

Comment in

References

    1. Aldahmesh MA, Mohamed JY, Alkuraya HS, Verma IC, Puri RD, Alaiya AA, Rizzo WB, Alkuraya FS. Recessive mutations in ELOVL4 cause ichthyosis, intellectual disability, and spastic quadriplegia. Am J Hum Genet. 2011;89:745–750. - PMC - PubMed
    1. Bakheet TM, Doig AJ. Properties and identification of human protein drug targets. Bioinformatics. 2009;25:451–457. - PubMed
    1. Barth P, Wallner B, Baker D. Prediction of membrane protein structures with complex topologies using limited constraints. Proc Natl Acad Sci U S A. 2009;106:1409–1414. - PMC - PubMed
    1. Boudker O, Verdon G. Structural perspectives on secondary active transporters. Trends Pharmacol Sci. 2010;31:418–426. - PMC - PubMed
    1. Brunger AT. Version 1.2 of the Crystallography and NMR system. Nat Protoc. 2007;2:2728–2733. - PubMed

Publication types

Substances