. 2012 May 9;20(5):911-23.
doi: 10.1016/j.str.2012.03.019.

Structural basis for calmodulin as a dynamic calcium sensor

Affiliations

Structural basis for calmodulin as a dynamic calcium sensor

Miao Zhang et al. Structure. .

Abstract

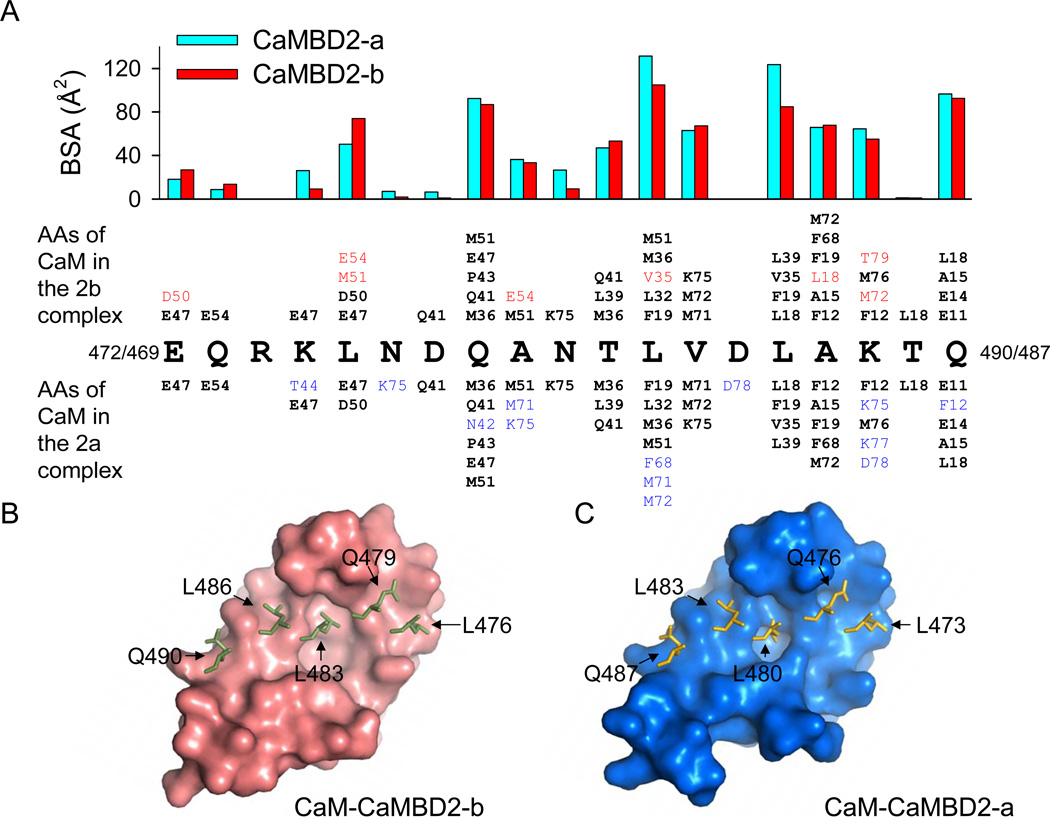
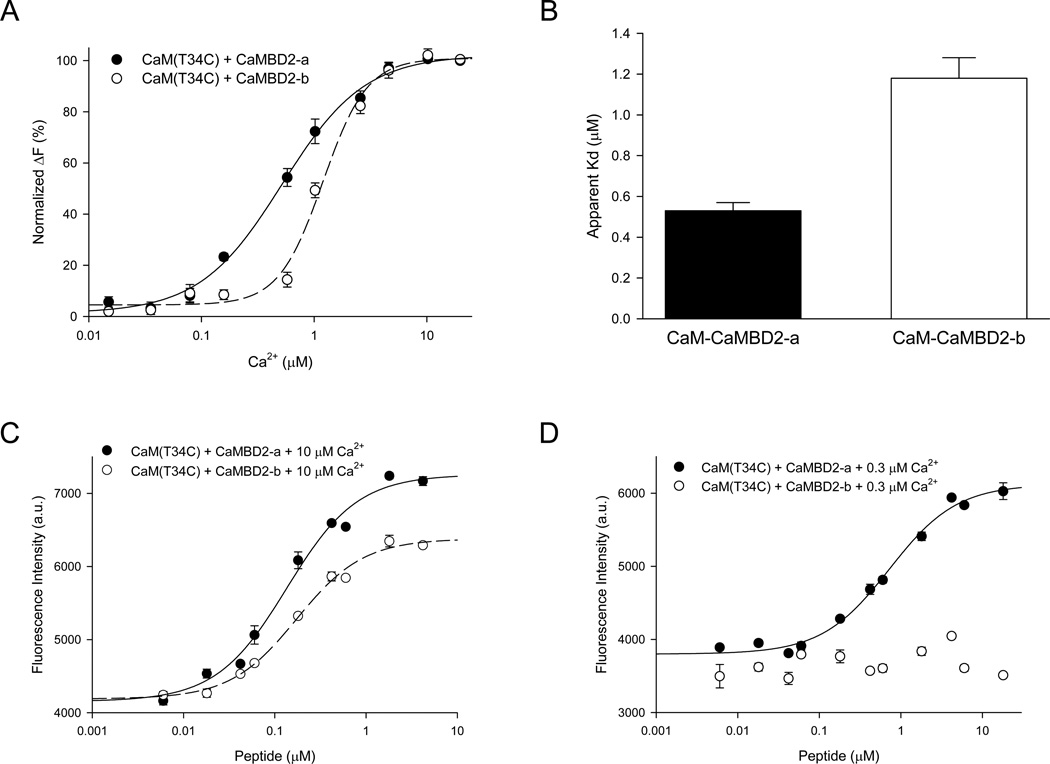
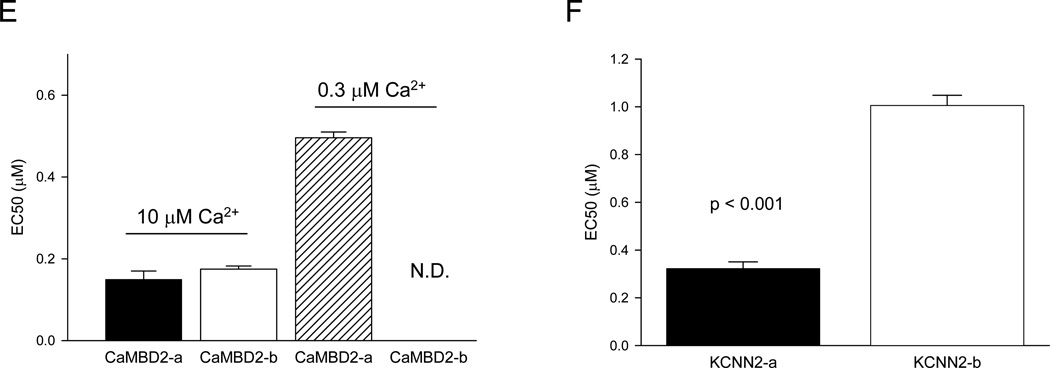
Calmodulin is a prototypical and versatile Ca(2+) sensor with EF hands as its high-affinity Ca(2+) binding domains. Calmodulin is present in all eukaryotic cells, mediating Ca(2+)-dependent signaling. Upon binding Ca(2+), calmodulin changes its conformation to form complexes with a diverse array of target proteins. Despite a wealth of knowledge on calmodulin, little is known on how target proteins regulate calmodulin's ability to bind Ca(2+). Here, we take advantage of two splice variants of SK2 channels, which are activated by Ca(2+)-bound calmodulin but show different sensitivity to Ca(2+) for their activation. Protein crystal structures and other experiments show that, depending on which SK2 splice variant it binds to, calmodulin adopts drastically different conformations with different affinities for Ca(2+) at its C-lobe. Such target protein-induced conformational changes make calmodulin a dynamic Ca(2+) sensor capable of responding to different Ca(2+) concentrations in cellular Ca(2+) signaling.


Conflict of interest statement

No conflict of interests for the authors involved in this work.

Figures

Figure 1
Figure 1. A distinct conformation of the CaM-CaMBD2-b complex
(A & B) Structure of the CaM-CaMBD2-b complex. A 2×2 complex is formed with two horizontal CaMBD2-b peptides, green, and two CaM molecules, salmon (A). Also shown are side chains of the three residues A463, R464 and K465 in CaMBD2-b. A 90°-turn of the structure shows that CaM in CaMBD2-b adopts an “S”-shaped configuration (B). (C & D) Structure of the CaM-CaMBD2-a complex (1G4Y). Two CaMBD2-a peptides, gold, and two CaM molecules, blue, form the 2×2 complex (C). CaM in the CaM-CaMBD2-a complex displays a “C”-like structure (D). (E & F) Comparison of the structures of CaM from CaM-CaMBD2-b (salmon) and CaM-CaMBD-2a (blue). The CaM structures are aligned at the N-lobe. Notice the difference at the linker region (R74-E82). See also Figure S1
Figure 2
Figure 2. Ca2+ promotes formation of a 2×2 complex for both CaM-CaMBD2-a and CaM-CaMBD2-b in solution
(A & B) A 1×1 complex of CaM-CaMBD2-a and CaM-CaMBD2-b in the absence of Ca2+. Upper panels are raw SE data (symbols) at different centrifugation speeds as indicated. Curves are fit of the raw data to a single-component model using Sedphat. Lower panels are residuals of the fit. Without Ca2+ both CaM-CaMBD2-a and CaM-CaMBD2-b are 1×1, with a predicted molecular mass of 28.9 kDa and 29.3 kDa respectively. (C & D) A 2×2 complex of CaM-CaMBD2-a and CaM-CaMBD2-b in the presence of Ca2+. Upper panels are raw SE data (symbols) with fit to a single-component model (curves), and lower panels are residuals of the fit. Ca2+ promotes formation of a 2×2 complex for both CaM-CaMBD2-a and CaM-CaMBD2-b with a predicted molecular mass of 57.8 kDa and 58.6 kDa respectively.
Figure 3
Figure 3. Different thermodynamic profiles for CaM-CaMBD2-b and CaM-CaMBD2-a
(A) Surface representation of the CaM-CaMBD2-b complex. CaMBD2-b (green) interacts with CaM (salmon) only at both the N- and C-lobes. There is no physical contact between the CaMBD2-b peptides. (B) Surface representation of the CaM-CaMBD2-a complex. The CaMBD2-a peptides (gold) form extensive contacts with CaM (blue) as well as between themselves. (C) Results of ITC experiments. Ca2+-bound CaM was titrated into either CaMBD2-a or CaMBD2-b. For CaM-CaMBD2-a, a two-site model is required to fit the data (the smooth line). On the other hand, a single-site model can adequately fit the data and use of the two-site model did not statistically improve the fitting. (D) Thermodynamic profiles for formation of the CaM-CaMBD2-a and CaM-CaMBD2-b complexes. Plotted are the Gibbs free energy (ΔG), enthalpy (ΔH) and entropy (−TΔS) for formation of both CaM-CaMBD2-a and CaM-CaMBD2-b. ΔG is calculated from ΔH and TΔS (Table S1), which were determined by ITC at 20°C (ΔG = ΔH − TΔS). See also Figure S2 and Table S1
Figure 4
Figure 4. Interactions of CaM and CaMBDs at the CaM N-lobe
(A) Amino acid residues involved in formation of CaM-CaMBD2-b and CaM-CaMBD2-a with Ca2+. Buried surface area (BSA, bar graphs) identifies key residues in CaMBD2-b and CaMBD2-a which interact with CaM. A C-terminal fragment, from E472/E469 to L491/L488, interacts with the CaM N-lobe. Insertion of ARK shifts the numbering by three for CaMBD2-b. Also listed are CaM residues, in a smaller type face, that are in contacts (within 5 Å radius) with individual CaMBD residues. Shown in red are the CaM residues which only interact with key residues in CaMBD2-b. CaM residues in cyan form contacts only with CaMBD2-a. CaM residues in a black bold type face interact with both. (B & C) Hydrophobic interfaces of the CaM N-lobe in complex with CaMBD2-b (B) or CaMBD2-a (C). Overlaid are key residues from CaMBD2-b or CaMBD2-a. Both N-lobes are aligned from L4 to R74, with r.m.s.d. = 0.86 Å, to create the graphs. See also Figure S3
Figure 5
Figure 5. Interactions of CaM and CaMBDs at the CaM C-lobe
(A) Amino acid residues involved in formation of CaM-CaMBD2-b and CaM-CaMBD2-a in the presence of Ca2+, similar to descriptions in Fig. 3. An N-terminal fragment, from R419 to L440, interacts with the CaM C-lobe. (B & C) Hydrophobic interfaces of the CaM C-lobe in complex with CaMBD2-b (B) or CaMBD2-a (C). Both C-lobes are aligned from I85 to T146, with r.m.s.d. = 2.53 Å, to create the graphs. See also Figure S4
Figure 6
Figure 6. Conformational plasticity of the CaM EF-hands
(A & B) Structures of EF-hands from CaM-CaMBD2-b (salmon) and CaM-CaMBD2-a (blue). EF-hands 1 and 2 are aligned from D20 to E31 and D56 to E67 respectively. EF-hands 3 and 4 are aligned from D93 to E104 and D129 to E140 respectively. Side chains at positions 7 and 9 are not shown. (C & D) Structures of EF-hands from CaM-CaMBD2-b (salmon) and the CaM-edema factor (pale cyan, 1K90). Significant differences exist in the structures of EF-hands 1 and 2, but not EF-hands 3 and 4. Side chains at positions 7 and 9 are not shown. See also Figure S5
Figure 7
Figure 7. The CaM-CaMBD2-b complex has a reduced apparent affinity for Ca2+
(A & B) Formation of CaM-CaMBD2-b (n = 4) complex is less sensitive to Ca2+, compared to that of CaM-CaMBD2-a (n = 7). Increases in fluorescence intensity (normalized) are plotted against free Ca2+ concentrations (A). There is a significant reduction in the apparent Kd for Ca2+ (p < 0.001, B). (C & D) Dose-dependent binding of CaMBD2-b (n = 3) and CaMBD2-a (n = 3) to AEDANS labeled CaM(T34C) in the presence of 10 µM Ca2+ (C) or 0.3 µM Ca2+ (D). CaM(T110C) yielded the same results. (E) The EC50 of CaM for CaMBDs obtained at 10 µM or 0.3 µM Ca2+. The EC50 of CaM for CaMBD2-b at 0.3 µM Ca2+ could not be determined (N.D.). (F) The EC50 for activation of SK2-b (n=10) and SK2-a (n=8) channels by Ca2+ from electrophysiology experiments, (P<0.001). See also Figure S6
Figure 8
Figure 8. A molecular model for changes in CaM’s affinity for Ca2+, induced by CaMBD2-b or CaMBD2-a
In the presence of Ca2+, CaM forms a 2×2 complex with both CaMBD2-b and CaMBD2-a in solution. Formation of the CaM-CaMBD2-b complex in the presence of Ca2+ requires that both the CaM N- and C-lobes become Ca2+-bound before they can interact with CaMBD2-b (A). The CaM C-lobe has a lower affinity for Ca2+ than the N-lobe (K1C < K1N), effectively determining the overall reduced Ca2+ sensitivity in formation of the 2×2 CaM-CaMBD2-b complex. In contrast, formation of the CaM-CaMBD2-a complex is Ca2+-dependent at the CaM N-lobe and becomes Ca2+-independent at the CaM C-lobe. (B). The open symbols represent the Ca2+-free EF-hands, while the filled circles and squares represent Ca2+-bound EF-hands. The open triangles represent EF-hands which are no longer able to bind Ca2+.

References

    1. Andersson A, Forsén S, Thulin E, HJ V. Cadmium-113 nuclear magnetic resonance studies of proteolytic fragments of calmodulin: assignment of strong and weak cation binding sites. Biochem. 1983;22:2309–2313. - PubMed
    1. Ataman ZA, Gakhar L, Sorensen BR, Hell JW, Shea MA. The NMDA Receptor NR1 C1 Region Bound to Calmodulin: Structural Insights into Functional Differences between Homologous Domains. Structure. 2007;15:1603–1617. - PMC - PubMed
    1. Bond CT, Maylie J, Adelman JP. SK channels in excitability, pacemaking and synaptic integration. Curr. Opin. Neurobiol. 2005;15:305–311. - PubMed
    1. Chin D, Means AR. Calmodulin: a prototypical calcium sensor. Trends Cell Biol. 2000;10:322–328. - PubMed
    1. Chagot B, Chazin WJ. Solution NMR Structure of Apo-Calmodulin in Complex with the IQ Motif of Human Cardiac Sodium Channel NaV1.5. J. Mol. Biol. 2011;406:106–119. - PMC - PubMed

Publication types

MeSH terms

Substances

LinkOut - more resources