

Review
doi: 10.1016/j.neulet.2012.05.001.
Epub 2012 May 8.
A dynamic network perspective of chronic pain
Affiliations
- PMID: 22579823
- PMCID: PMC3377811
- DOI: 10.1016/j.neulet.2012.05.001
Item in Clipboard
Review
A dynamic network perspective of chronic pain
Neurosci Lett.
.
Abstract
We briefly summarize recent advances regarding brain functional representation of chronic pain, reorganization of resting state brain activity, and of brain anatomy with chronic pain. Based on these observations and recent theoretical advances regarding network architecture properties, we develop a general concept of the dynamic interplay between anatomy and function as the brain progresses into persistent pain, and outline the role of mesolimbic learning mechanisms that are likely involved in maintenance of chronic pain.
Copyright © 2012 Elsevier Ireland Ltd. All rights reserved.
Figures
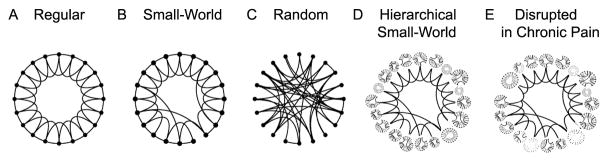
Illustrates the seminal theoretical observation that, between Regular (A) and Random (C) connected networks, there is a group of network structures (Small-World Network, B) where a small number of long distance connections increases the efficiency and stability of the network architecture (adapted from [36]). Given the observed properties of the brain connectome [31], it is more accurately represented by an overarching hierarchy of nested, regional small-world networks (Hierarchical Small-World Network, D). We speculate that over time, the presence of chronic pain alters the functional connectivity of these nested regional networks and their crosstalk (through the preferential reduction and/or enhancement of local and but not long-distance node interactions), in a pain condition-specific manner (E).
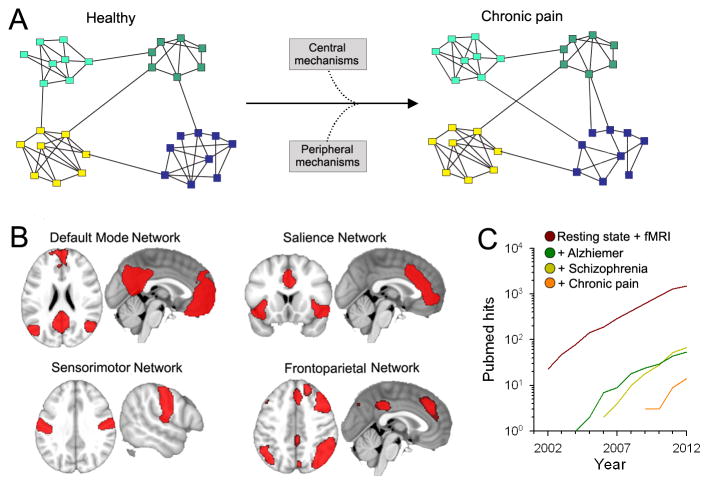
(A) The brain can be represented as a network where the nodes correspond to constitutive elements, or nodes (voxels from MRI, neurons, etc.), and these nodes form links based on some type of interaction between nodes. Complex networks also have a tendency to exhibit a modular topology, where links are concentrated within modules. The presence of chronic pain may alter the properties of these modules through changes in inter- or intra-modular interactions, through peripheral and central mechanisms (figure adapted from Bullmore et al. [23]) These may be viewed as subcomponents of the local modules depicted in Fig. 1. (B) Resting state fMRI show that several networks composed of modules (regions) can be identified from the fluctuating patterns of intrinsic activity seen in the human brain. Shown are four major resting state brain networks that might be relevant to pain processes (adapted from [8]). (C) Number of hits in PubMed for search of “Resting state AND fMRI”. The number of studies using resting state analyses exhibits an exponential growth over the last decade. Also shown are resting state studies performed in patients suffering from Alzheimer’s disease and schizophrenia, which are a magnitude higher than the number of studies conducted in chronic pain.
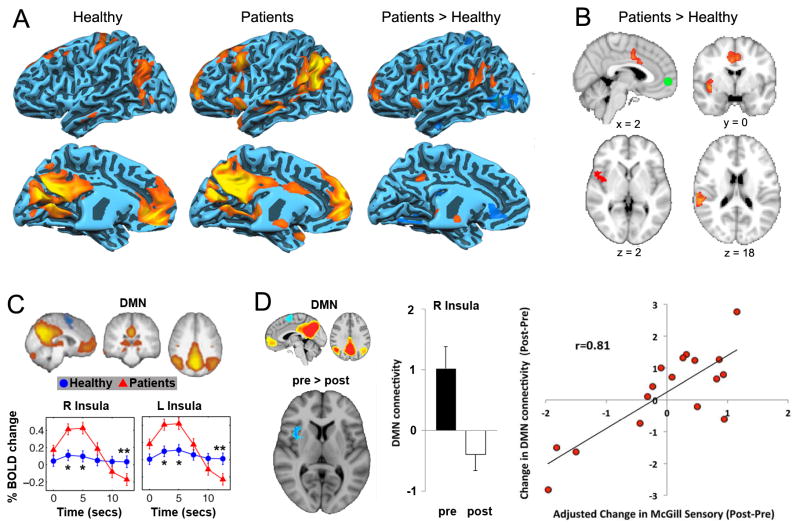
(A) Data adapted from Cauda et al. [10] showing that the default mode network (DMN) shows increased connectivity to the anterior and posterior portions of the insula in patients suffering from diabetic neuropathic pain. (B) Similar results were observed during resting state in chronic back pain patients from our lab, for which the MPFC, a main constituent of the DMN, showed increased correlation to the insula and ACC in patients [4]. (C) Similarly, Tagliazucchi et al. [32] found that the insula is more likely to show increased activity immediately following MPFC activity, only in pain patients but not healthy controls (figure adapted from [32]). (D) Napadow et al. showed that the correlation between DMN-insula activity reduces following treatment in fibromyalgia patients. In addition to these changes, this coupling was related to a change in pain parameters (adapted from [25]). These results collectively suggest that the DMN shows increased coupling with pain-related regions, indicating that chronic pain alters brain dynamics at rest.
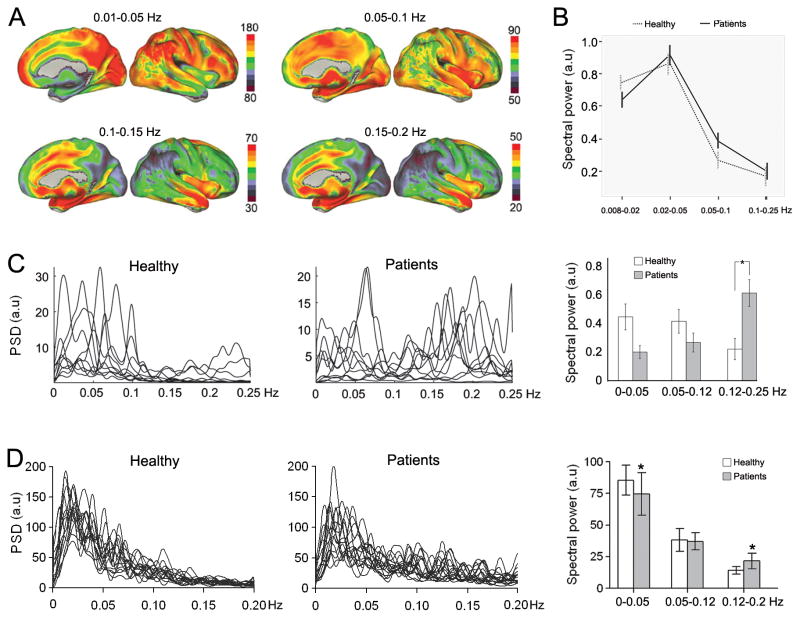
(A) The resting state brain shows robust frequency-dependent organization. Brain maps show the spatial distribution of spectral power for four frequency bands (0.01–0.05 Hz, 0.05–0.1 Hz, 0.1–0.15 Hz, and 0.15–0.2 Hz) in healthy subjects. The lowest-frequency band (0.01–0.05 Hz) has the highest power, and is localized mainly in the prefrontal, parietal, and occipital cortices. The higher-frequency bands exhibit less power, and localize more within the cingulate, insula, temporal cortex, and subcortical structures (adapted from [8]). (B) The DMN showed increased power in high frequency BOLD oscillations (0.05–0.1 Hz) in diabetic neuropathic pain patients (adapted from [10]). (C) Chronic pain patients show higher frequency oscillations in the insula. Line plots represent the normalized spectra for insular activity (individual subject data superimposed), separately for healthy controls and patients. Bar graphs show the mean ± SEM spectral power for different frequency bands in healthy and patients (adapted from [22]). (D) MPFC activity in chronic back pain patients, indicating higher frequency oscillations in the MPFC, to a lesser extent than in the insula (C).
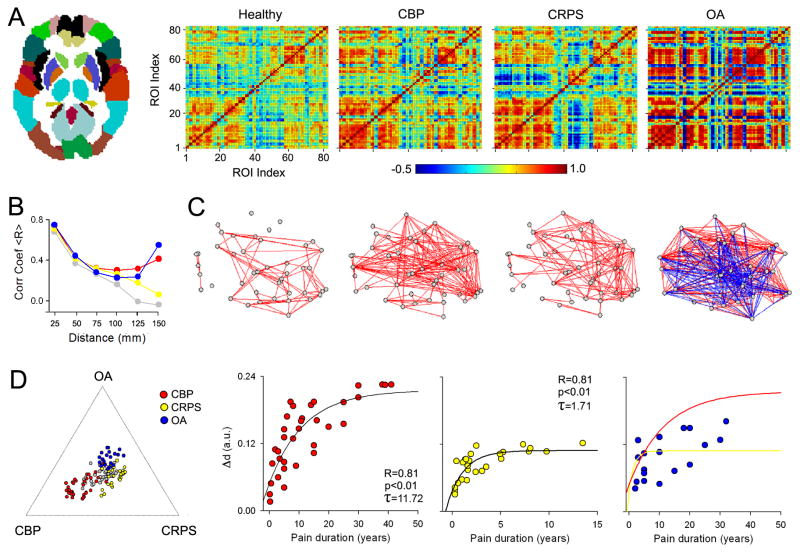
(A) The relationships between grey matter regions were studied by calculating pair-wise correlations of grey matter density between the 82 Brodmann Area-defined regions (left panel) across subjects, separately for healthy controls, CBP, CRPS, and OA. The resulting correlation matrices show widespread increases in correlation strength (i.e., more blue and red, indicating decreased and increased similiarites in grey matter pairs) in all three patient groups, compared to controls. (B) Line plots show the pair-wise correlations (for 41 regions in left hemisphere) plotted against the mean distance between pairs of regions. Healthy subjects show a linear dependency on distance, indicating that grey matter density in proximal pairs of regions is more similar than density between distal pairs of regions. This relationship is disrupted in unique ways in each chronic pain condition, where patients show higher correlations between pairs of regions that are far apart (for statistical details, see [7]). (C) Graph representation of the data in (A) showing the association between the pairs of regions. Red and blue lines represent positive and negative correlations (links), grey date are the pairs of regions (nodes). (D) The left plot shows relative locations of individual subjects based on the global grey matter structural reorganization that characterizes each condition (indicated by the extremities of the plot, in relation to the center, healthy brains) Right scatter plots show the relationship between global grey matter structural reorganization to pain duration, which follows an exponential growth function, distinct in patients with different pain conditions. All figures adapted from [7].
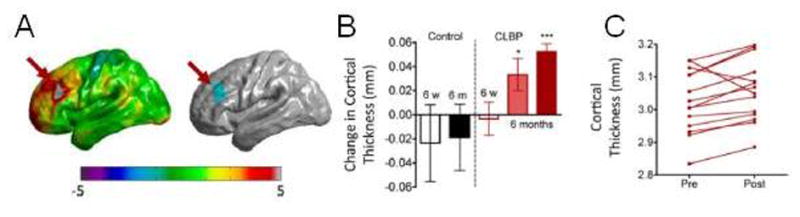
(A) Changes in cortical thickness of the left dorsolateral prefrontal cortex (DLPFC) were observed 6 months following significant pain reduction with spine surgery or facet joint injections in chronic low back pain patients (B, dark red bar). (C) The majority of individual patients showed increases in DLPFC cortical thickness following treatment. Figures adapted from [28].
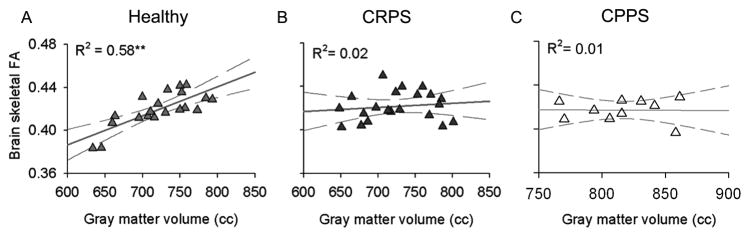
(A) The healthy brain is characterized by a positive correlation between grey and white matter integrity (estimated with diffusion tensor imaging using fractional anisotropy, FA) after correcting for age, suggesting that this anatomical interrelationship reflects the brain’s natural organizational properties. In contrast, the brains of individuals with (B) complex regional pain syndrome (CRPS) and (C) male chronic pelvic pain syndrome (CPPS) show a complete dissolution of this grey-white matter relationship. These findings indicate that some chronic pain conditions are associated with massive brain anatomical changes that may dramatically impact how neurons communicate, locally and globally. Figures adapted from [13,14].
References
Publication types
MeSH terms
Grants and funding
LinkOut - more resources
Full Text Sources
Medical
