Review
. 2012 Sep;31(5):407-41.
doi: 10.1016/j.preteyeres.2012.04.003. Epub 2012 May 3.

Lateral interactions in the outer retina

Affiliations
Review

Lateral interactions in the outer retina

Wallace B Thoreson et al. Prog Retin Eye Res. 2012 Sep.

Abstract

Lateral interactions in the outer retina, particularly negative feedback from horizontal cells to cones and direct feed-forward input from horizontal cells to bipolar cells, play a number of important roles in early visual processing, such as generating center-surround receptive fields that enhance spatial discrimination. These circuits may also contribute to post-receptoral light adaptation and the generation of color opponency. In this review, we examine the contributions of horizontal cell feedback and feed-forward pathways to early visual processing. We begin by reviewing the properties of bipolar cell receptive fields, especially with respect to modulation of the bipolar receptive field surround by the ambient light level and to the contribution of horizontal cells to the surround. We then review evidence for and against three proposed mechanisms for negative feedback from horizontal cells to cones: 1) GABA release by horizontal cells, 2) ephaptic modulation of the cone pedicle membrane potential generated by currents flowing through hemigap junctions in horizontal cell dendrites, and 3) modulation of cone calcium currents (I(Ca)) by changes in synaptic cleft proton levels. We also consider evidence for the presence of direct horizontal cell feed-forward input to bipolar cells and discuss a possible role for GABA at this synapse. We summarize proposed functions of horizontal cell feedback and feed-forward pathways. Finally, we examine the mechanisms and functions of two other forms of lateral interaction in the outer retina: negative feedback from horizontal cells to rods and positive feedback from horizontal cells to cones.


Figures

Fig. 1
Fig. 1
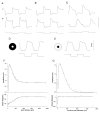
The receptive field surround of monkey cone-driven bipolar cells exhibits both surround activation and surround antagonism when the mean background illumination is maintained in the photopic range. (A–C)Responses of three diffuse monkey cone bipolar cells to 100% luminance contrast. (A, B)Two OFF-center bipolar cells hyperpolarized to a 1° diameter spot that stimulated only the receptive field center (upper traces) and depolarized to a 5° spot that stimulated both center and surround (lower traces). Temporal frequency was 2.44 Hz in A and 1.22 Hz in B. (C) ON-center bipolar cell depolarized to the 1° spot (upper trace) and hyperpolarized to the 5° spot (lower trace). Stimulus temporal frequency was 2.44 Hz. Scale bar = 6 mV for traces in A and 2 mV for traces in B and C. Stimulus waveform is shown below the traces. (D–G) Center-surround receptive field structure of an OFF-center, midget cone bipolar cell from monkey retina. (D) Cell hyperpolarized to a small 150 μm diameter spot centered on the receptive field. (E) Cell depolarized to an annulus (inner diameter = 150 μm; outer diameter = 1200 μm). Stimulus waveform is shown below the traces in D and E. (F, G) Responses of the same cell to sinusoidally flickering spots (2.44 Hz) of increasing size (F) and sinusoidally flickering annuli (2.44) Hz) of increasing inner diameter (G). All stimuli were centered on the receptive field and presented on a steady photopic background of the same mean luminance as the stimuli (1000 td). Modulation contrast was 100%. Fourier analysis was used to determine the amplitude and phase of the cell’s center (spot) and surround (annular) responses at the temporal frequency of the stimulus modulation. Upper plots in F and G show response amplitude, lower plots show response phase. Solid lines in F and G are the difference of Gaussians model fits to the data. The ratio of the surround to center weights for this cell was 0.7. The phase of the responses in degrees is relative to the phase of the sinusoidally flickering spots and annuli. Modified from Dacey et al. (2000).
Fig. 2
Fig. 2
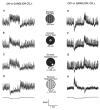
ON-center and OFF-center alpha (brisk transient) rabbit ganglion cells produce both center and surround light responses under photopic background conditions, but the surround is absent or minimal under scotopic conditions. Under dark-adapted, scotopic background illumination conditions, ON-center (A, B, and C on left side) and OFF-center (E, F, and G on right side) ganglion cells evoked center responses to full-field scotopic illumination (A and E), to a dim spot stimulus centered on the cell soma (B and F), and to a dim spot stimulus displaced to the edge of the receptive field, 450 μm from the soma (C and G). Under maintained light-adapted photopic background illumination, the ON-center (D) and OFF-center (H) ganglion cells generated opposite polarity surround responses to a small spot stimulus displaced to the edge of the receptive field, 450 μm from the soma. Spots (85 μm diameter) were 2.5 log units brighter than the background in all cases. Occurrence of light stimuli is indicated by the step traces below the voltage responses. Modified from Muller and Dacheux (1997).
Fig. 3
Fig. 3
Responses of an OFF-center bipolar cell (A) and an ON-center bipolar cell (B) to contrast steps of positive and negative contrast presented in the center and surround of the receptive field. (A) The center stimulus was a spot of 272 μm in diameter. The surround stimulus was a concentric annulus of 393 μm inner diameter (i.d.) and 2030 μm outer diameter (o.d.) (B) The center stimulus was a spot of 515 μm in diameter. The surround stimulus was a concentric annulus of 757 μm i.d. and 2030 μm o.d. The contrasts of the steps were ±.03, ±.07, and ±.50 as shown on the left. The retina was adapted to a steady, 20 cd/m2background field of 2030 μm in diameter. Modified from Fahey and Burkhardt (2003).
Fig. 4
Fig. 4
Light response characteristics of six bipolar cell types (A) and scatter plots of their receptive field properties (B). (A) Voltage responses of the six bipolar cell types elicited by a center light spot (300 μm diameter) and a surround light annulus (700 μm inner diameter, 2000 μm outer diameter). The surround light annulus was of the same intensity (700 nm, −2 log Io, where Io was the unattenuated intensity of 500 nm light = 2.05 × 10⁷ photons/μm2/s) for all 6 cells whereas the intensity of the center light spot was adjusted so that it allowed the annulus to produce the maximum response. (B) Scatter plots of relative surround/center response ratio [S/(Ct − Cs)] versus spectral difference ΔS of ON-center bipolar cells (open triangles and dashed line) and OFF-center bipolar cells (filled circles and solid line). Straight lines are linear regression lines of the data points. S, Ct, and Cs are the surround, transient center, and sustained rebound responses, respectively. The spectral difference ΔS of a cell was defined as S700 − S500, in which S700 and S500 are the intensities of 700 and 500 nm light stimuli that elicit responses of the same amplitude. Because ΔS of rods is ~3.4 and that for cones is ~0.1 in the tiger salamander retina (Yang and Wu, 1990), bipolar cells with ΔS > 2.0 were defined as rod-dominated, those with ΔS < 1.0 were defined as cone-dominated, and those with 1.0 < ΔS < 2.0 were defined as mixed rod-cone bipolar cells. Modified from Zhang and Wu (2009).
Fig. 5
Fig. 5
Examples of simultaneous recordings in the carp retina from a luminosity-type (L-type) H1 cone horizontal cell and a nearby ON-center bipolar cell (A) and a different L-type H1 cone horizontal cell and a nearby OFF-center bipolar cell (B). (A) Responses of the L-type horizontal cell (a) and the ON-center bipolar cell (b) to diffuse white light and to polarization of the horizontal cell by a current of 20 nA. (B) Responses of an L-type horizontal cell (a) and a nearby OFF-center bipolar cell (b) to diffuse white light and to polarization of the horizontal cell by a current of 20 nA. Similar effects of current injections into chromaticity-type (C-type) cone horizontal cells on nearby ON-center and OFF-center bipolar cells as shown here were also observed (Toyoda and Kujiraoka, 1982). Following light adaptation of the fish retina, L-type H1 cone horizontal cells hyperpolarize to all wavelengths (400–700 nm) of visible light, whereas one kind of C-type (H2) cone horizontal cell depolarizes to red (e.g., 650 nm) stimuli but hyperpolarizes to blue and green stimuli, and a second kind of C-type (H3) cone horizontal cell depolarizes to green (e.g., 500 nm) stimuli but hyperpolarizes to blue and red stimuli. L-type and C-type cone horizontal cells all hyperpolarize to full-field (diffuse) white light stimuli. Modified from Toyoda and Kujiraoka,1982 (©1982 Rockefeller University Press).
Fig. 6
Fig. 6
(A, B) Antagonism of the spot (receptive field center) responses of an ON-center brisk sustained rabbit ganglion cell by light stimulation of the receptive field surround with an annulus or by hyperpolarizing current injections into a nearby horizontal cell. The magnitude of the antagonistic effect on the spot response of the ganglion cell was greater with larger amplitude (10 nA), than with smaller amplitude (4 nA), current injections. Each data point represents the average response of the ganglion cell (spikes/s) to five flashes of the spot stimulus. (A) Spot alone (filled circles), spot and annulus (open circles), and spot and 10 nA hyperpolarizing current (filled triangles) data are shown. (B) Spot alone (filled circles), spot and 4 nA hyperpolarizing current (open circles), and spot and 10 nA hyperpolarizing current (filled triangles) data are shown. The spot (400 μm diameter) was presented alone, in conjunction with a constant intensity annulus (i.d. = 750 μm; o.d. = 3 mm), or in conjunction with the hyperpolarizing phase of a sinusoidally modulated current (0.1 Hz) injected into the horizontal cell located 225 μm laterally from the ganglion cell. A full-field light background of 0.5 cd/m2 (mesopic range) was present throughout the course of the experiment. Modified from Mangel (1991).
Fig. 7
Fig. 7
Responses of a turtle cone to small (70 μm) and large (600 μm) spots of equal intensity light. The small and large spots evoked the same peak hyperpolarization but the large spots also evoked a delayed depolarization (Baylor et al., 1971).
Fig. 8
Fig. 8
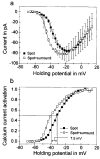
Effects of negative feedback from horizontal cells onto cone ICa in goldfish retina. Compared to ICa measured while steadily illuminating the cone with a small spot of light (filled squares), illumination of the receptive field surround (open squares) caused ICa to activate at more negative membrane potentials (A), shifting activation leftward along the voltage axis (B). Note the increase in peak amplitude of ICa that accompanies this leftward shift (Verweij et al., 1996).
Fig. 9
Fig. 9
Schematic representation of the ephaptic feedback hypothesis. Horizontal (HC) and bipolar cell (BC) dendrites enter the invaginating cone synapse. The synaptic ribbon is represented as a vertical black bar (R) surrounded by white synaptic vesicles. The location of cone Ca2+ channels are shown in red, connexins in the HC membrane are shown in blue, and leak potassium channels are shown in gray (Fahrenfort et al., 2009).
Fig. 10
Fig. 10
The chloride cotransporters, Na-K-2Cl (NKCC) and K-Cl (KCC), determine whether GABAA receptor activation, which opens chloride (Cl) channels, depolarizes or hyperpolarizes neurons, respectively. ON-center cone bipolar cell (BC) dendrites express NKCC and OFF-center cone bipolar cell dendrites express the KCC subtype, KCC2. See text for details.
Fig. 11
Fig. 11
Light-induced currents of an OFF rabbit ganglion cell that was voltage clamped at the Cl reversal potential (VH of −45 mV) to reveal the excitatory signal arriving from bipolar cells. (A) Spots of increasing diameters elicited transient inward currents that were strongly attenuated with large spots. (B) Application of picrotoxinin (100 μM) caused a substantial increase of the light-evoked currents and became more sustained, and large spots did not attenuate the currents. (C) Area–response curves showing the charge transfer (in picocoulombs) of the currents in A and B, respectively. (D) Normalized area–response curves of the records in A and B, respectively. In the control record, the large spot attenuation is apparent, and during application of picrotoxinin this attenuation appears to be primarily blocked. The intensity of the background illumination (= 0.7 cd/m2) maintained the retina under mesopic light conditions. Modified from Flores-Herr et al. (2001).

References

    1. Agardh E, Bruun A, Ehinger B, Storm-Mathisen J. GABA immunoreactivity in the retina. Invest Ophthalmol Vis Sci. 1986;27:674–678. - PubMed
    1. Agardh E, Ehinger B, Wu JY. GABA and GAD-like immunoreactivity in the primate retina. Histochem. 1987;86:485–490. - PubMed
    1. Ammermüller J, Muller JF, Kolb H. The organization of the turtle inner retina. II Analysis of color-coded and directionally selective cells. J Comp Neurol. 1995;358:35–62. - PubMed
    1. Arvanitaki A. Effects evoked in an axon by activity of a contiguous one. J Neurophysiol. 1942;5:89–108.
    1. Asi H, Perlman I. Neural interactions between cone photoreceptors and horizontal cells in the turtle (Mauremys caspica) retina. Vis Neurosci. 1998;15:1–13. - PubMed

Publication types

LinkOut - more resources