Review
. 2012 Sep;31(5):377-406.
doi: 10.1016/j.preteyeres.2012.04.004. Epub 2012 May 3.

Cellular and physiological mechanisms underlying blood flow regulation in the retina and choroid in health and disease

Affiliations
Review

Cellular and physiological mechanisms underlying blood flow regulation in the retina and choroid in health and disease

Joanna Kur et al. Prog Retin Eye Res. 2012 Sep.

Abstract

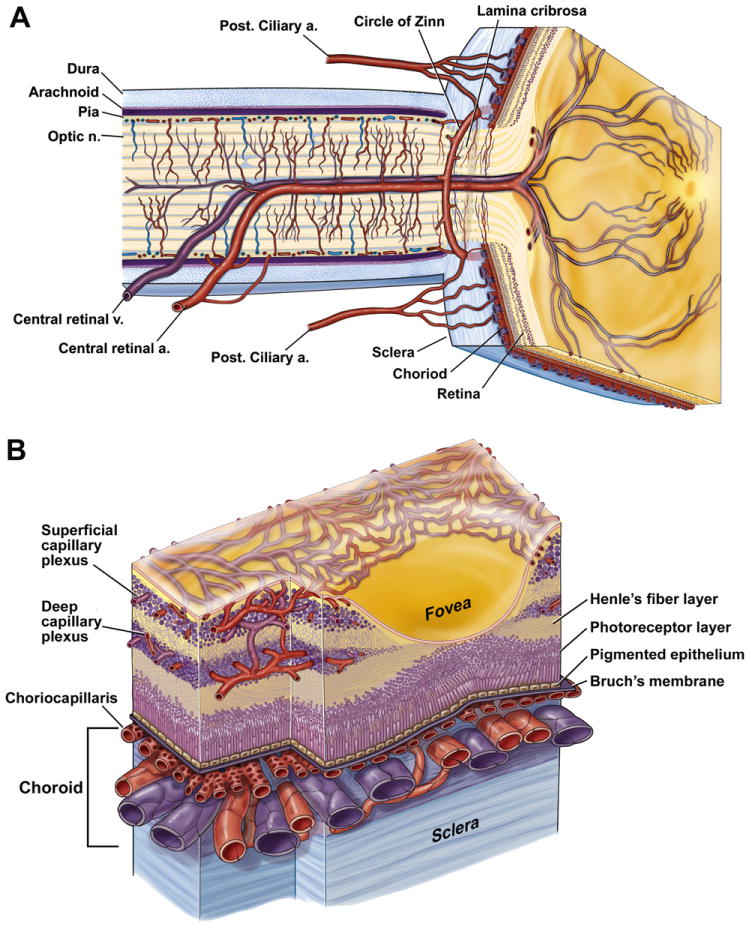
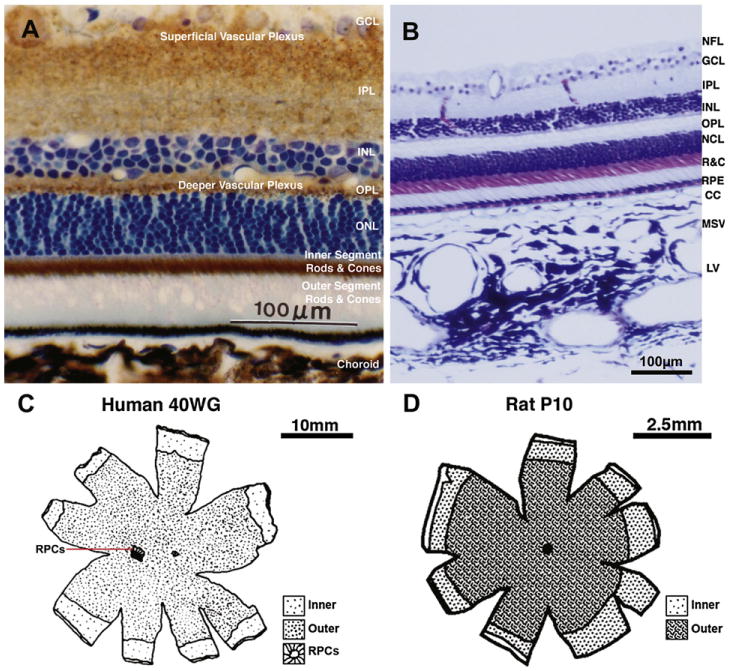
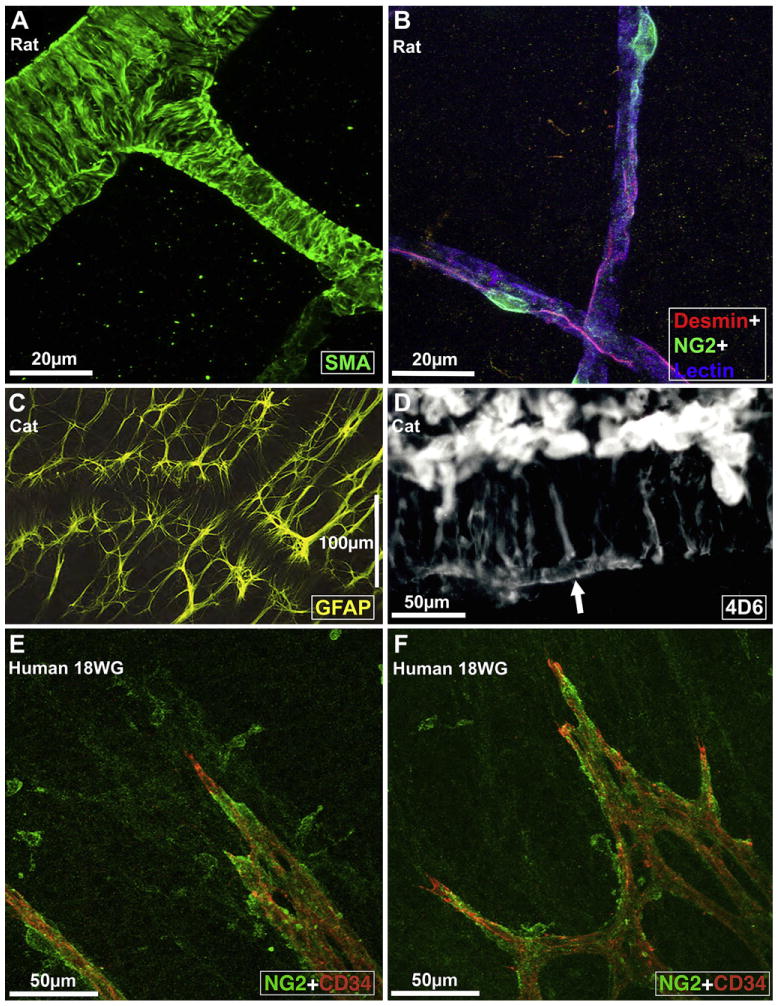
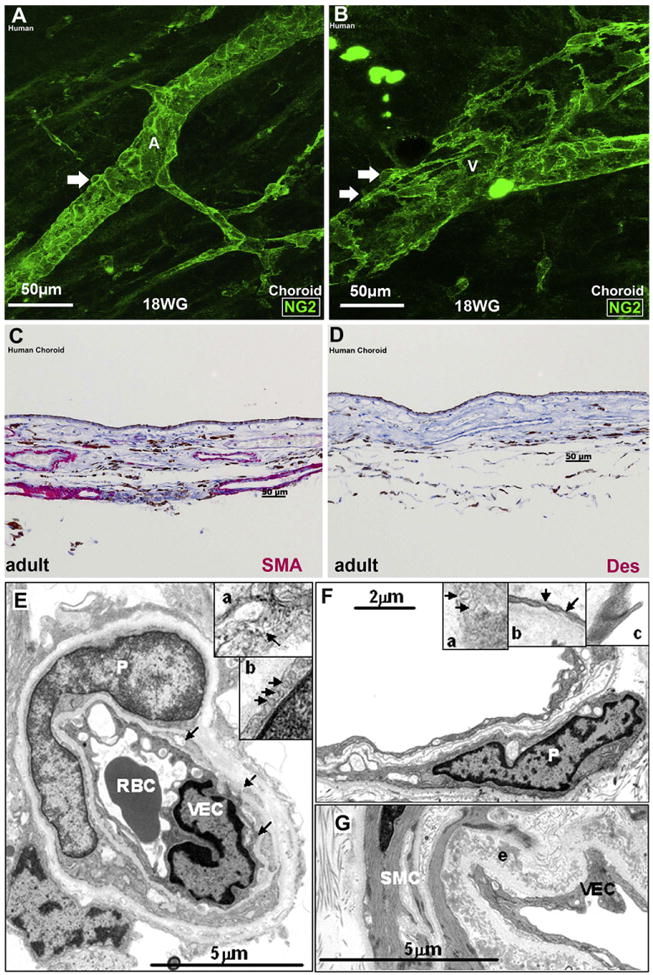
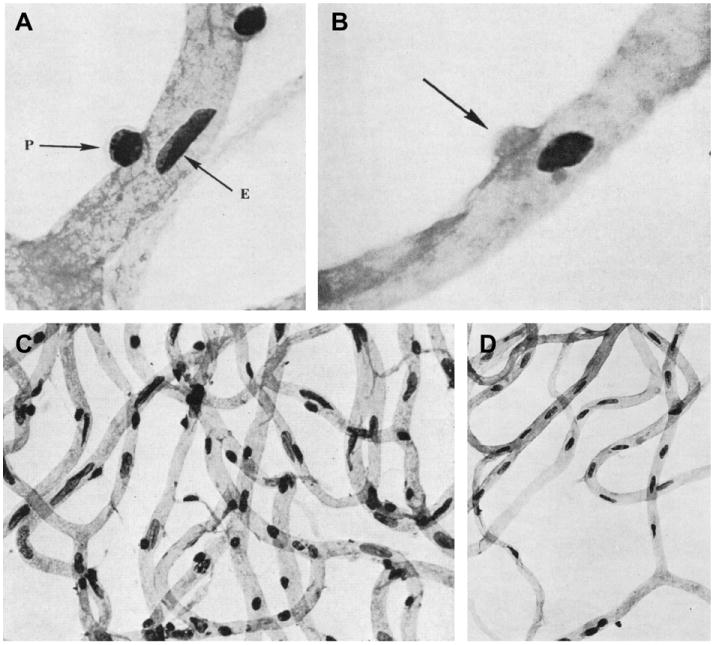
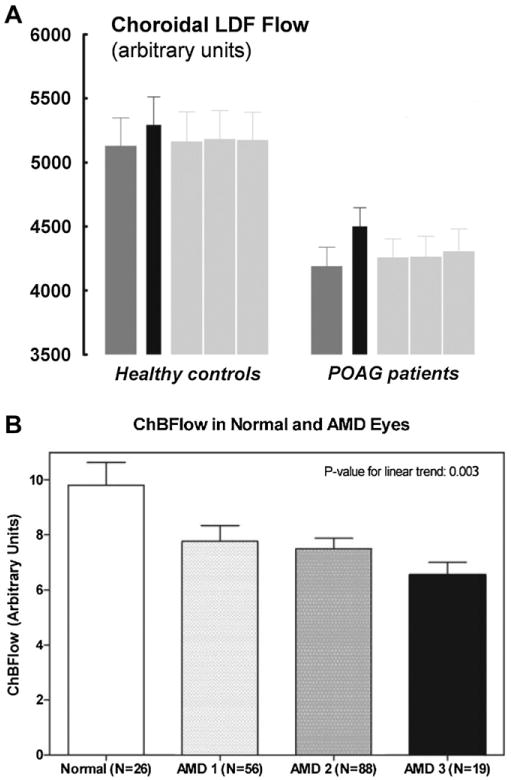
We review the cellular and physiological mechanisms responsible for the regulation of blood flow in the retina and choroid in health and disease. Due to the intrinsic light sensitivity of the retina and the direct visual accessibility of fundus blood vessels, the eye offers unique opportunities for the non-invasive investigation of mechanisms of blood flow regulation. The ability of the retinal vasculature to regulate its blood flow is contrasted with the far more restricted ability of the choroidal circulation to regulate its blood flow by virtue of the absence of glial cells, the markedly reduced pericyte ensheathment of the choroidal vasculature, and the lack of intermediate filaments in choroidal pericytes. We review the cellular and molecular components of the neurovascular unit in the retina and choroid, techniques for monitoring retinal and choroidal blood flow, responses of the retinal and choroidal circulation to light stimulation, the role of capillaries, astrocytes and pericytes in regulating blood flow, putative signaling mechanisms mediating neurovascular coupling in the retina, and changes that occur in the retinal and choroidal circulation during diabetic retinopathy, age-related macular degeneration, glaucoma, and Alzheimer's disease. We close by discussing issues that remain to be explored.


Figures

Fig. 1
Fig. 1
Anatomy of ocular circulation (a-artery, b-vein, n-nerve). A, Cut away drawing along the superior–inferior axis of the human eye through the optic nerve, showing the vascular supply to the retina and choroid. B, Drawing showing vasculature of the retina and choroid. Drawings by Dave Schumick from Anand-Apte and Hollyfield (2009).
Fig. 2
Fig. 2
A, Transverse section of the rat retina, showing the relative expression of the metabolic enzyme cytochrome oxidase (COX) (reaction product in brown) throughout the retinal layers. COX histochemistry is used for mapping regional brain/retinal metabolism in animals, since there is a direct relation between enzyme activity and neuronal activity. The section has been counterstained with toluidine blue to demonstrate the location of cell nuclei layers. Note the highest level of cytochrome oxidase activity is in the inner segments of the rods and cones. GCL, ganglion cell layer; IPL, inner plexiform layer; INL, inner nuclear layer; OPL, outer plexiform layer; ONL, outer nuclear layer; inner and outer segments of the photoreceptors; from Buttery, PhD Thesis, 1990. B, Transverse section of the primate retina and choroid stained with Toluidine Blue and Nissl, showing retinal layers and the three vascular layers of the choroid. NFL, nerve fiber layer; R&C, rods and cones; RPE, retinal pigment epithelium; CC, choriocapillaris; MSV, medium and small choroidal vessels; LV, large choroidal vessels Chan-Ling, unpublished data. C, Map showing the outer limits of the inner (superficial) and outer (deep) vascular plexus as well as that of the radial peripapillary capillaries (RPCs) at 40 weeks gestation in the human retina (from Hughes et al., 2000). D, Map showing the outer limits of the inner (superficial) and outer (deep) vascular plexus at a postnatal day (P) 10 in the rat retina. No RPCs have been described in the rat retina to date; from Stone et al. (1995).
Fig. 3
Fig. 3
Fine structure of retinal vessels and glia ensheathment. A, Rat retinal arterioles (postnatal day 21) labeled for smooth muscle actin (SMA), a smooth muscle cell differentiation marker (from Hughes and Chan-Ling, 2004). B, Capillaries in the adult rat retina triple labeled with Griffonia Simplicifolia isolectin B4 (GS) lectin (blue), anti-desmin (red), and anti-NG2 (green); from Hughes and Chan-Ling (2004). C, Morphology of astrocytes immunolabeled with GFAP (at the level of the superficial vascular plexus) in the cat retina wholemount. Note close association between astrocytes, the vessel wall, and the nerve fiber bundles that run diagonally across the field of view; from (Chan-Ling, unpublished). D, The broken edge of a retinal wholemount, labeled with 4D6, a monoclonal antibody specific to Müller cells; from Dreher et al. (1988). The inner endfeet of Müller cells (top) are brightly fluorescent. At the outer margin of the inner nuclear layer Müller cell processes outline a capillary (arrow); from Dreher et al., 1988. E and F: Micrographs showing the intimate relationship between NG2+ pericytes and the CD34+ angiogenic tip cells of the developing retinal blood vessels in human retinal wholemounts at 18 weeks gestation. The NG2+ pericytes are located just ahead of the leading edge of patent CD34+ vessels; from Chan-Ling et al. (2011b).
Fig. 4
Fig. 4
Pericyte and smooth muscle cell ensheathment of the retinal and choroidal vasculature. A and B: Human choroidal wholemounts at 18 weeks' gestation showing NG2+ somas (arrows) on the abluminal surface of an artery (A) and vein (V), respectively. Note that NG2+ pericyte ensheathment is more continuous in the artery than in the vein. C-D, Transverse sections of adult human choroid stained with SMA and desmin, respectively. (C) Most of the choroidal vessels are stained with SMA, (D) Desmin does not stain the choroidal vessels. The brown pigment in C and D is melanin. E, A transmission electron microscopy (TEM) of an adult human retinal capillary showing pericyte (P) ensheathment, red blood cell (RBC) and a vascular endothelial cell (VEC); arrows indicate fragments of pericyte cytoplasm. (Inset a) High magnification of a portion of the pericyte cytoplasm showing intermediate filaments (arrow). (Inset b) Portion of a pericyte showing pinocytotic vesicles (arrows). F, TEM of an adult human choroidal capillary with an associated pericyte (P). (Inset a) High magnification of the choroidal pericyte cytoplasm. Note the lack of filaments. Arrows: pinocytotic vesicles. (Inset b) High magnification of a vascular endothelial cell (VEC) showing fenestrae (arrows). (Inset c) High magnification of the junctions present in the VEC. G, TEM of an adult human choroidal arteriole. Well-developed smooth muscle cells (SMCs) with numerous organized thin filaments with focal densities are present. Pinocytotic vesicles and complete basal lamina are visible. An elastin (e) layer is also present in this vessel; from Chan-Ling et al. (2011b).
Fig. 5
Fig. 5
VEGF expression during formation of retinal blood vessels. Schematic representation of the retina from the optic disc (at right) to the periphery of the retina (at left) in rat and cat. Rat P1/Cat E60: The neural retina is comprised of two cellular layers. The outer (cytoblast) layer is still generating neurones, and mitotic figures are numerous at the outer surface of the neural retina, adjacent to the pigment epithelium. The choroid circulation is well formed, and the hyaloid artery extends through the optic disk to supply the vitreous body and the lens. Astrocytes (in green) have begun to migrate across the surface of the retina, and the superficial layer of vessels has begun to form. At this and subsequent ages, VEGF (in yellow) is expressed more strongly in the RPE than in astrocytes. Rat P4/Cat P10: The spread of astrocytes and superficial vessels has continued, and the first “descending” vessels have begun to bud from the superficial layer. VEGF expression is strong in the most peripheral astrocytes, but has faded in astrocytes near the optic disk. Rat P7/Cat P15: The separation of the cytoblast into the inner and outer nuclear layers, by the formation of the outer plexiform layer, has begun near the optic disk; where this separation has taken place, cell division has halted. Astrocytes have reached the edge of the retina, the most peripheral of them expressing VEGF and the superficial layer of vessels has spread correspondingly. Expression of VEGF is now apparent in the INL and, correspondingly, some descending vessels have reached the level of the deep vascular plexus, near the optic disk. Rat P10/Cat P20: The division of the retina into its layers is almost complete. VEGF expression in astrocytes has subsided, and expression in the INL is restricted to the peripheral margin of the retina. Rat P14/Cat P35: The formation of the neural retina and its vasculature is essentially complete. VEGF expression by astrocytes has subsided and expression in the INL is restricted to the peripheral margin of the retina; with modification from Stone et al. (1995).
Fig. 6
Fig. 6
Expression of smooth muscle actin (SMA), calponin and caldesmon in the retinal and choroidal vasculature. A, Schematic representation of the extent of SMA, calponin, and caldesmon expression (red) in the vasculature (green) of an adult rat retina. Note that SMA expression extends the furthest, reaching the secondary arterioles with weaker expression on capillary and post-capillary venules. Caldesmon expression extends partially past the first branch point from the primary arteriole. In contrast, calponin expression is no longer detectable past the first branch point from the primary arterioles; from Hughes and Chan-Ling (2004). B–F, SMA staining in arterioles (B) and venules (C) in the human choroid at 32 weeks' gestation. Note the incomplete coverage of the venule with SMA filaments. (D–F) Human choroid at 19.5 weeks gestation labeled with calponin and SMA. Calponin and SMA are present only on the larger vessels (from Chan-Ling et al., 2011b).
Fig. 7
Fig. 7
Autoregulation of blood flow in the retina. Blood flow in the human optic nerve head (Fonh) remains stable over a range of perfusion pressures (PPm). Perfusion pressure changes were induced either by increases in blood pressure (circles) or by elevation of intraocular pressure (triangles). Fonh values were normalized to 100% at baseline. The change in PPm is expressed as percentage of baseline pressure; from Movaffaghy et al. (1998).
Fig. 8
Fig. 8
Change in retinal vascular diameter and retinal blood flow to light stimulation. A, Maximum red blood cell velocity (Vmax) measured in a vein using laser Doppler velocimetry after 5 min of fundus illumination and after 20 min of darkness in humans; from Riva et al. (1983). B, Mean arterial diameter response to flicker measured using the retinal vessel analyzer (RVA) in humans; from Nagel and Vilser (2004). C, Blood velocity response to flicker stimulation measured from the rim of the optic disc in cats with laser Doppler flowmetry; from Riva et al. (2005).
Fig. 9
Fig. 9
Local changes in blood flow evoked by focal stimulation. (A) Functional magnetic resonance imaging (fMRI) images of the cat eye stimulated with a drifting grating presented to the upper visual field (left) and the lower visual field (right). Red and yellow regions indicate increased blood flow. (B) Percent change in fMRI signals evoked by visual stimulation (black bars); from Duong et al. (2002).
Fig. 10
Fig. 10
Blood velocity increases evoked by focal (top) and diffuse (bottom) flickering light stimulation in the rat retina. The left panels show confocal images of the retina and right panels show blood velocity changes measured with laser speckle flowmetry. Focal stimulation (small white bars in A and B) evokes a local increase in blood flow (red region in B) while diffuse stimulation evokes a blood flow increase over the entire retina (red and yellow regions in D). Pseudocolor scale bars indicate percent change in blood velocity; from Srienc et al. (2010).
Fig. 11
Fig. 11
Contractile responses of retinal pericytes. A, UTP-induced constriction of a capillary lumen adjacent to two pericytes (indicated by black arrows) in the rat retina; from Peppiatt et al. (2006). B, Cholinergic agonist-induced constriction of a pericyte-containing capillary from a freshly isolated adult rat retina. The arrows point to a pericyte that constricts during exposure to oxotremorine-M. Scale bar, 5 μm; from Wu et al. (2003a).
Fig. 12
Fig. 12
Summary of signaling pathways that mediate neurovascular coupling in the central nervous system. Synaptically released glutamate acts on NMDA receptors in neurons (NMDAR) to raise [Ca2+]i, causing neuronal nitric oxide synthase (nNOS) to release NO, which activates smooth muscle guanylate cyclase. Raised [Ca2+]i may also (dashed line) generate arachidonic acid (AA) from phospholipase A2 (PLA2), which is converted to prostaglandins (PG) that dilate vessels. Glutamate also raises [Ca2+]i in astrocytes by activating metabotropic glutamate receptors (mGluR), generating arachidonic acid and three types of AA metabolites: prostaglandins and EETs in astrocytes, which dilate vessels, and 20-HETE in smooth muscle, which constricts vessels. A rise of [Ca2+]i in astrocyte endfeet may also activate Ca2+-gated K+ channels (gK(Ca); alternative abbreviation: BK), releasing K+, which also dilates vessels. In the retina, Müller glial cells are activated by ATP rather than glutamate released from neurons. Calcium increases in Müller cells result in the release PG and EETs onto smooth muscle cells, which dilate vessels, and 20-HETE production, which constricts vessels; from Attwell et al. (2010).
Fig. 13
Fig. 13
Glial cell stimulation evokes vasodilation of retinal arterioles. A–C, Fluorescence images showing a Ca2+ increase that propagates through several glial cells following stimulation by photolysis of caged-Ca2+ (yellow dot in A). D-F, IR-DIC images of the boxed region in A, each acquired 0.5 s after the corresponding image above. Glial stimulation evokes a dilation of the arteriole, indicated by the yellow arrowheads. G, Time course of glial Ca2+ change and vessel dilation; from Metea and Newman (2006).
Fig. 14
Fig. 14
Autoregulation of choroidal blood flow in humans. Change in mean choroidal blood flow (ChBFm) is plotted versus mean ocular perfusion pressure (PPnorm), where PP was decreased by slowly increasing the intraocular pressure. Both ChBFm and PP are normalized. Note that relationship is not linear, indicating an autoregulatory mechanism. Error bars represent the 95% confidence interval; from Riva et al. (1997b).
Fig. 15
Fig. 15
Light responses of the choroidal vasculature. Change in choroidal blood flow (FLOW), measured with laser Doppler flowmetry, and the fundus pulsation amplitude (FPA), measured with laser interferometry, during darke–light transitions. Note that transition from light to dark results in a decrease in choroidal blood flow, not only in the stimulated (index) eye, but also in the contralateral eye; from Fuchsjager-Mayrl et al. (2001).
Fig. 16
Fig. 16
Reduced functional hyperemia response in the diabetic retina. A, Flicker-induced dilation of retinal arteries and veins is reduced in patients with type 1 diabetes; from Pemp et al. (2009). B and C, Flicker-induced vasodilation is reduced in the diabetic rat retina. The iNOS inhibitor aminoguanidine, given intravenously (diabetic AG-IV), or in drinking water (diabetic AG-H2O), reverses the loss of vasodilation; from Mishra and Newman (2012).
Fig. 17
Fig. 17
Loss of pericytes in diabetic retinopathy. A, Normal human retinal capillaries showing intramural pericytes (P) and endothelial cells (E). B, Mural ghost pericyte (arrow) in a human diabetic retina. C, Capillary meshwork in a healthy retina, showing a normal ratio of endothelial cells to pericytes. D, Capillary meshwork in a diabetic retina. Note marked loss of pericytes (round nuclei) with preservation of endothelial cells (elongated nuclei). Trypsin digestion, periodic acid-Schiff (PAS) and hematoxylin stain; from Speiser et al. (1968).
Fig. 18
Fig. 18
Choroidal blood flow in glaucoma and age-related macular degeneration. A, Choroidal blood flow in glaucoma patients, measured with laser Doppler flowmetry (LDF) at baseline (dark gray bar), during a hand-grip exercise (black bar), and during recovery (light gray bars). Note the lowered blood flow in primary open-angle glaucoma (POAG) patients; from Portmann et al. (2011). B, Reduced choroidal blood flow in age-related macular degeneration (AMD). Relative choroidal blood flow (ChBFlow) in control subjects (Normal) and AMD patients, measured with laser Doppler flowmetry. Patients were divided into three groups according to their ophthalmoscopic AMD features associated with increased risk of choroidal neovascularization; from Grunwald et al. (2005).

References

    1. Akata T. Cellular and molecular mechanisms regulating vascular tone. Part 2: regulatory mechanisms modulating Ca2+ mobilization and/or myofilament Ca2+ sensitivity in vascular smooth muscle cells. J Anesth. 2007;21:232–242. - PubMed
    1. Alder VA, Ben-Nun J, Cringle SJ. PO2 profiles and oxygen consumption in cat retina with an occluded retinal circulation. Invest Ophthalmol Vis Sci. 1990;31:1029–1034. - PubMed
    1. Allende A, Madigan MC, Provis JM. Endothelial cell proliferation in the choriocapillaris during human retinal differentiation. Br J Ophthalmol. 2006;90:1046–1051. - PMC - PubMed
    1. Alm A, Bill A. The oxygen supply to the retina. I. Effects of changes in intraocular and arterial blood pressures, and in arterial PO2 and PCO2 on the oxygen tension in the vitreous body of the cat. Acta Physiol Scand. 1972a;84:261–274. - PubMed
    1. Alm A, Bill A. The oxygen supply to the retina. II. Effects of high intraocular pressure and of increased arterial carbon dioxide tension on uveal and retinal blood flow in cats. A study with radioactively labelled microspheres including flow determinations in brain and some other tissues. Acta Physiol Scand. 1972b;84:306–319. - PubMed

Publication types

MeSH terms