. 2013 Mar 14;32(11):1408-15.
doi: 10.1038/onc.2012.161. Epub 2012 May 14.

PGE2 promotes renal carcinoma cell invasion through activated RalA

Affiliations

PGE2 promotes renal carcinoma cell invasion through activated RalA

Z Li et al. Oncogene. .

Abstract

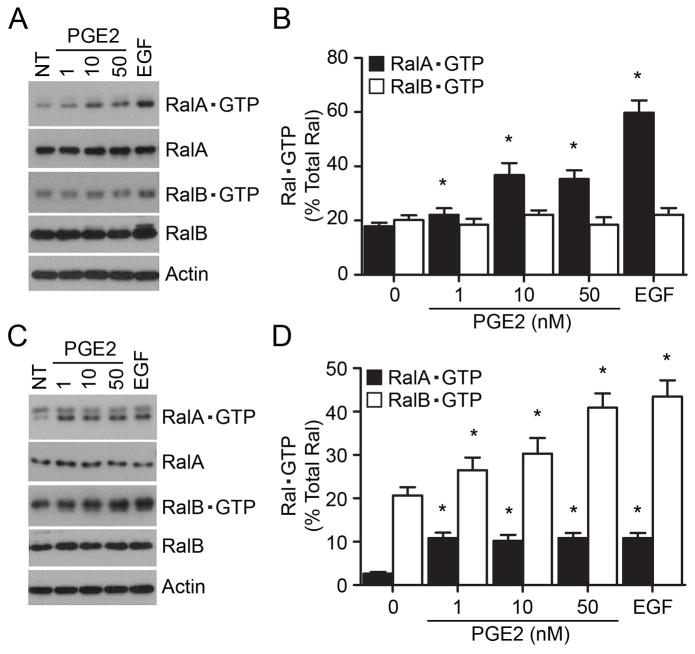
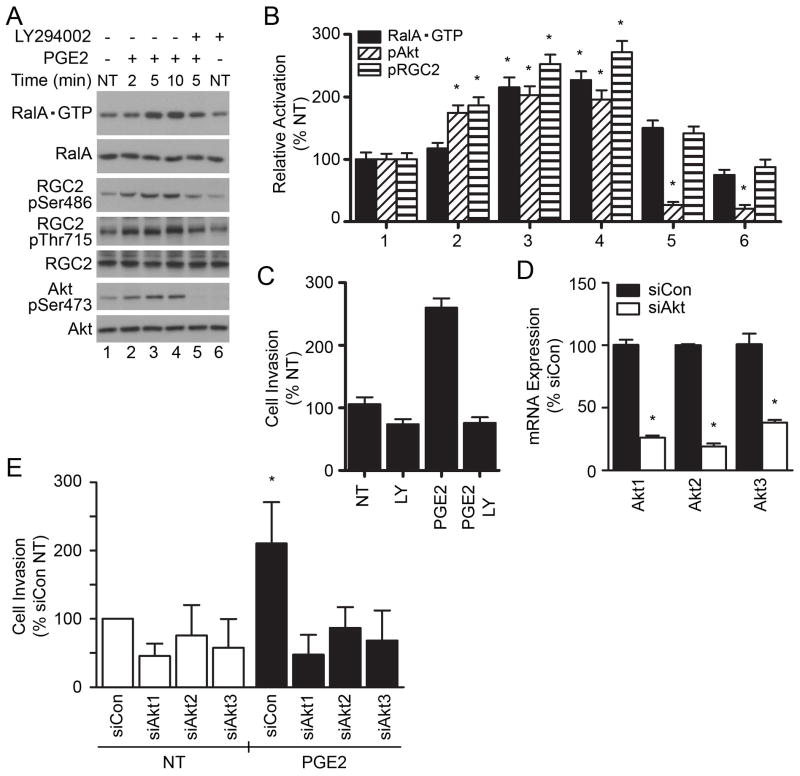
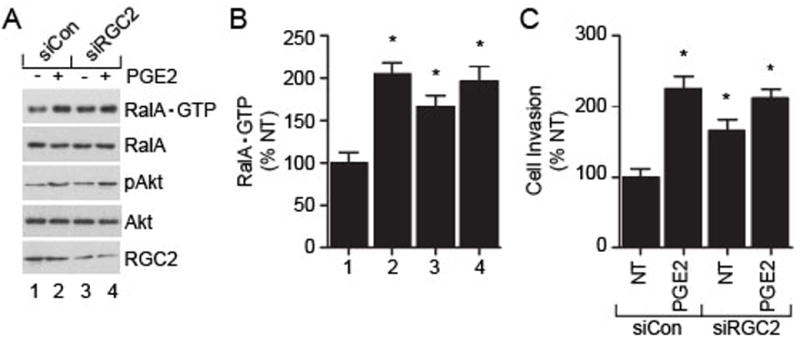
Incidence of kidney cancer is on the rise, and a better understanding of molecular mechanisms involved in the cancer invasion and metastasis is required for the development of curative therapeutics. In this study, we report that the proinflammatory cytokine prostaglandin E2 (PGE2) induces the malignant SN12C, but not benign HK2 kidney cell invasion. The PGE2 increases SN12C cell invasion through a signal pathway that encompasses EP2 and EP4, Akt, small GTPase RalA and Ral·GTP inactivator RGC2. The results support the idea that targeted interference of EP2/EP4 signal to RalA·GTP may provide benefit to patients diagnosed with advanced kidney cancer.


Conflict of interest statement

Competing Interest Statement

The authors declare no competing financial interests.

Figures

Fig. 1
Fig. 1. PGE2 promotes SN12C renal cancer cell invasion
(A) Effect of PGE2 on the invasion of malignant SN12C and benign HK2 kidney cells. Equal number of SN12C and HK2 cells were starved overnight and allowed to invade Matrigel-coated transwell filters in the presence, or absence, of PGE2 (nM) or EGF (20 nM) for 18 hr. Cells that invaded the matrix and migrated to the bottom side of the filter were stained with Diff-Quik. Cells in four randomly-selected fields were counted using a phase-contrast microscope and are presented as percent change in comparison to control not-treated (NT) samples. Each point represents the mean ± S.E.M. of values obtained from three independent experiments performed in duplicate, and * P < 0.05 versus corresponding not-treated samples. (B) Representative microscopic images of migrated cells. (C) Effect of PGE2 on the kidney cell proliferation. Cells were stimulated, or not, with PGE2 (50 nM) for 24 hr at 37°C, detached and incubated with 0.1% trypan blue stain solution. Cells excluding the dye were counted under light microscopy with a hemocytometer. Each point represents the mean ± S.E.M. of values obtained from three independent experiments.
Fig. 2
Fig. 2. Effect of PGE2 on Ral activation
(A) PGE2 increases the RalA•GTP but not RalB•GTP expression levels in cancer SN12C cells. SN12C cells were treated, or not, for 5 min with the indicated concentration of PGE2 (in nM) or EGF (20 ng/ml). Cell lysates were used in pull-down assays using GST-RalBP1-RBD fusion protein conjugated to glutathione agarose beads. Protein complexes on beads were washed four times (twice in lysis buffer, once in lysis buffer containing 500 mM NaCl, and once more in lysis buffer). Levels of RalA•GTP, RalB•GTP, and total RalA, RalB and Actin proteins were determined using anti-RalA, anti-RalB, and anti-Actin antibodies. Shown are representative blots from a single experiment. (B) Quantitative analysis of RalA•GTP and RalB•GTP levels in SN12C cells. (C) Effect of PGE2 treatment on RalA•GTP and RalB•GTP expression in benign HK2 cells. Levels of Ral•GTP proteins were determined exactly as described under A. (D) Quantitative analysis of RalA•GTP and RalB•GTP levels in HK2 cells. For results shown in panels B and D, data are presented as a percent of Ral•GTP over total Ral (in the whole cell lysate) and each point represents the mean ± S.E.M. of values obtained from at least three independent experiments. * P < 0.05 versus corresponding control not-treated (NT) samples.
Fig. 3
Fig. 3. Effect of RalA knockdown on SN12C cell invasion
Knockdown of endogenous RalA in SN12C (A) and HK2 (B) cells. Cells were transiently transfected with control siRNA (siCon), RalA or RalB siRNA for 24 hr followed by starvation for another 24 hr. Expression of RalA and Actin were determined by Western blot, and the levels of detected Actin served as a control for total protein loading. Requirement of RalA in the PGE2-induced SN12C (C) and HK2 (D) cell invasion. Cells transfected with control siRNA (siCon), RalA or RalB siRNA were analyzed for PGE2 (50 nM) effect on cell invasion. Data are presented as percent change in comparison to not-treated (NT) samples and each point represents the mean ± S.E.M. of values obtained from three independent experiments. * P < 0.05 versus corresponding not-treated (NT) samples.
Fig. 4
Fig. 4. EP2 and EP4 mediate the SN12C cell invasion
(A) Effect of EP ligand agonists and antagonists on RalA•GTP expression, RGC2 phosphorylation, and Akt phosphorylation. Cells were pre-treated with AH6809 or AH23848 for 30 min prior to stimulation with PGE2 (50 nM), butaprost (1 μM), or PGE1-OH (10 nM) for additional 5 min. RalA•GTP levels were determined with pull down assay. SN12C cell lysates were used to determine phosphorylation content of RGC2 (on Ser 486 and Thr 715 residues) and Akt (on Ser 473) by Western blot. Expression of total Akt is presented to demonstrate the equal protein loading among the different samples. (B) Quantitation of RalA•GTP, phospho-Akt and phospho-Ser486-RGC2. Band intensities were quantified and are presented as percent change in RalA•GTP, phospho-Akt, or phospho-RGC2 (Ser486) bands intensities, compared to corresponding not-treated samples that are arbitrarily assigned 100%. Numbers for the x-axes correspond to sample designation in A. (C) Effect of EP ligand agonists and antagonists on SN12C cell invasion. Cells were treated as in A and analyzed for invasion. Values for y-axis are percent change in comparison to not-treated (NT) samples. For panels B and C, each point represents the mean ± S.E.M. of values obtained from three independent experiments. * P < 0.05 versus corresponding vehicle control-treated samples.
Fig. 5
Fig. 5. PGE2 activates RalA and SN12C cell invasion through Akt
(A) Inhibition of PI3K with LY294002 attenuates the PGE2-induced RalA•GTP expression. SN12C cells were pretreated with LY294002 (50 μM) for 2 hr followed by treatment with PGE2 (50 nM) for the indicated time (min). Cell lysates were analyzed for expression of RalA•GTP by pull-down assay, as described. The cell lysates were also analyzed for expression of phospho-Akt, total Akt, phospho-RGC2, and total RGC2 by Western blot. (B) Quantitative analysis of RalA•GTP, phospho-Akt and phospho-Ser486-RGC2. Calculations were performed exactly as described in Fig. 4B. Each point represents the mean ± S.E.M. of values obtained from three independent experiments. * P < 0.05 versus corresponding vehicle control treated samples. Numbers for the x-axis correspond to sample designation in A. (C) Effect of LY294002 on the PGE2-induced SN12C cell invasion. Cells were pretreated with LY294002 for 2 hr followed by addition of PGE2 for additional 16 hr. Cell invasion of Matrigel matrix was performed using the transwell assay. Each point represents the mean ± S.E.M. of values obtained from three independent experiments. * P < 0.05 versus vehicle control not-treated (NT) samples. LY, LY294002. (D) Knockdown of Akt genes. SN12C cells were transiently transfected with control siRNA (siCon) or siRNA targeting Akt1, Akt2 or Akt3 genes for 24 hr followed by starvation for another 24 hr. Expression of individual Akt genes was determined by quantitative PCR. Each point represents the mean ± S.E.M. of values obtained from three independent experiments. * P < 0.05 versus siCon-transfected cells. (E) Effect of Akt expression on PGE2-regulated SN12C invasion. Cells transfected with control siRNA (siCon), Akt1, Akt2 or Akt3 siRNA were analyzed for PGE2 effect on cell invasion. Data are presented as percent change in comparison to siRNA-transfected and not-treated (NT) samples and each point represents the mean ± S.E.M. of values obtained from three independent experiments. * P < 0.05 versus corresponding siRNA-transfected and not-treated (NT) samples.
Fig. 6
Fig. 6. Role of RGC2 in the PGE2-induced SN12C cell invasion
SN12C cells were transfected with control siRNA (siCon) or RGC2 siRNA (siRGC2) for 24 hr followed by incubation in starvation medium for additional 36 hr. (A) Cells were divided and analyzed for expression of RalA•GTP by pull-down assay and phospho-Akt by Western blot. (B) Quantitation of RalA•GTP. Calculations were performed exactly as described in Fig. 2. Each point represents the mean ± S.E.M. of values obtained from three independent experiments, and * P < 0.05 versus corresponding vehicle control (1) treated samples. Numbers for the x-axis correspond to sample designation in A. (C) Role of RGC2 in the PGE2-induced SN12C cell invasion. Cells transfected with control siRNA (siCon) or RGC2 siRNA were treated with PGE2 (50 nM) for 18 hr and analyzed for invasion. For data shown in panels B and C, each point represents the mean ± S.E.M. of values obtained from three independent experiments. * P < 0.05 versus corresponding not-treated (NT) control samples.

References

    1. Siegel RWE, Brawley O, Jemal A. The impact of eliminating socioeconomic and racial disparities on premature cancer deaths. CA Cancer J Clin. 2011;61:212–36. - PubMed
    1. Young AN, Dale J, Yin-Goen QQ, Harris WB, Petros JA, Datta MW, et al. Current trends in molecular classification of adult renal tumors. Urology. 2006;67:873–80. - PubMed
    1. Sun M, Lughezzani G, Perrotte P, Karakiewicz PI. Treatment of metastatic renal cell carcinoma. Nat Rev Urol. 2010;7:327–38. - PubMed
    1. Biswas S, Eisen T. Immunotherapeutic strategies in kidney cancer - when TKIs are not enough. Nat Rev Clin Oncol. 2009;6:478–87. - PubMed
    1. Schlesinger-Raab A, Treiber U, Zaak D, Holzel D, Engel J. Metastatic renal cell carcinoma: Results of a population-based study with 25 years follow-up. Eur J Cancer. 2008;44:2485–95. - PubMed

Publication types

MeSH terms

Substances