. 2012 Jun;15(6):853-61.
doi: 10.1038/nn.3107.

Channel properties reveal differential expression of TARPed and TARPless AMPARs in stargazer neurons

Affiliations

Channel properties reveal differential expression of TARPed and TARPless AMPARs in stargazer neurons

Cécile Bats et al. Nat Neurosci. 2012 Jun.

Abstract

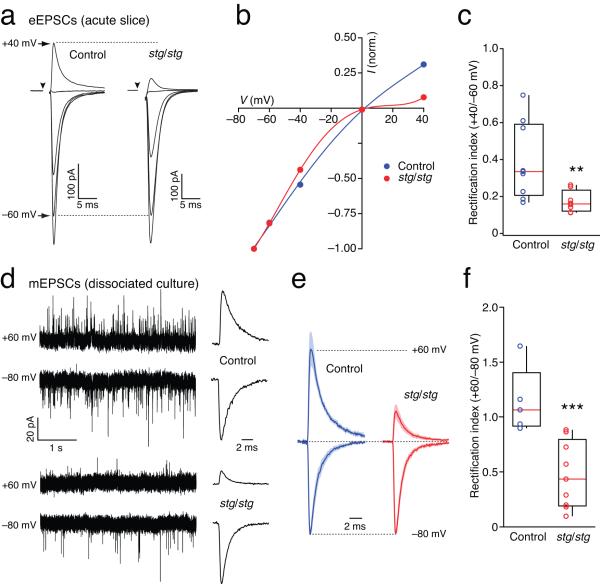
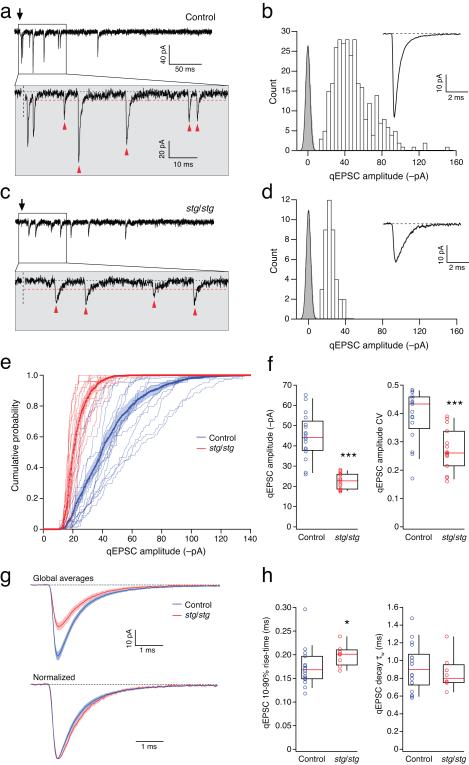
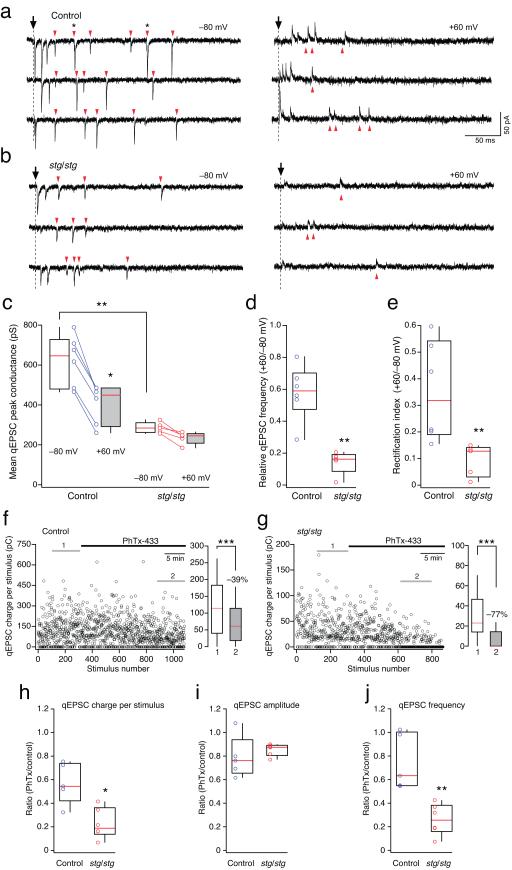
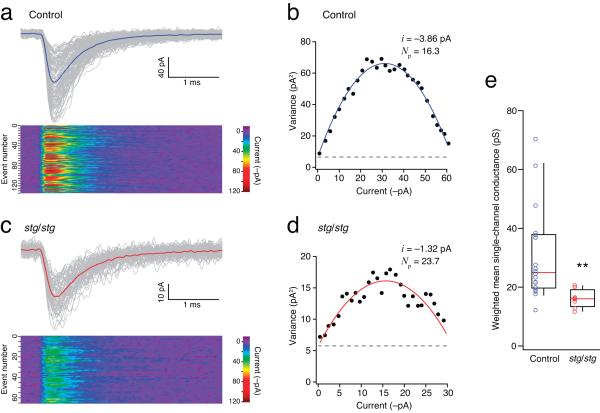
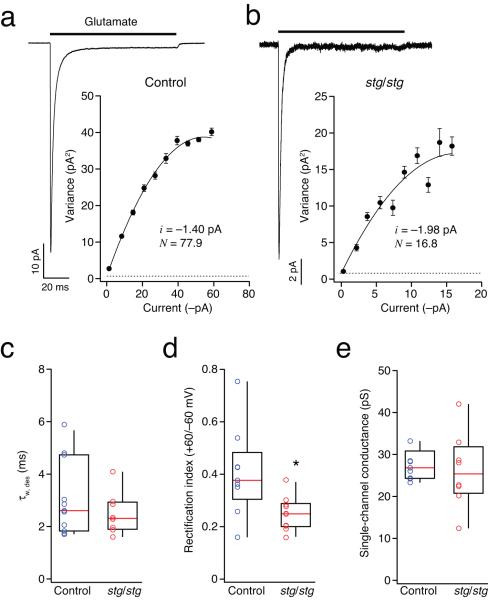
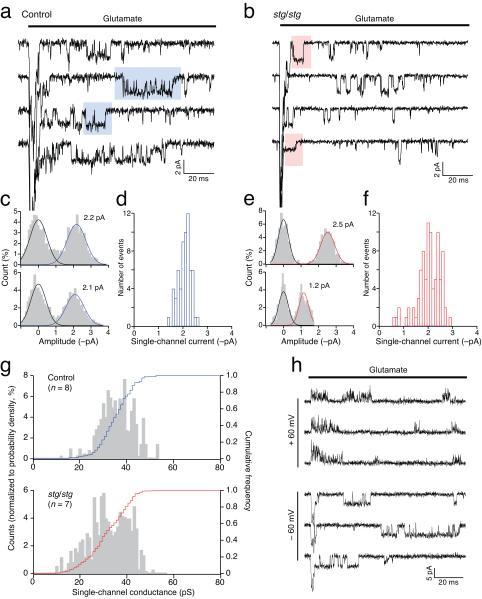
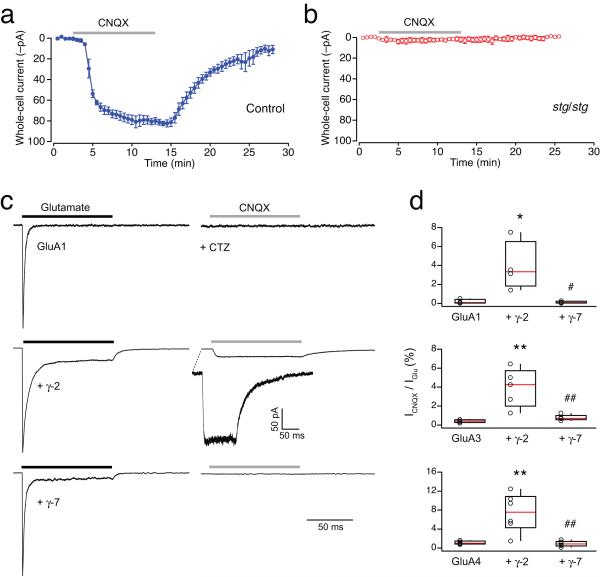
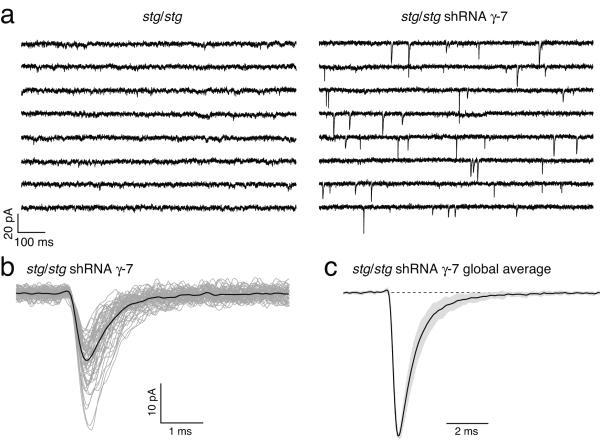
Dynamic regulation of calcium-permeable AMPA receptors (CP-AMPARs) is important for normal synaptic transmission, plasticity and pathological changes. Although the involvement of transmembrane AMPAR regulatory proteins (TARPs) in trafficking of calcium-impermeable AMPARs (CI-AMPARs) has been extensively studied, their role in the surface expression and function of CP-AMPARs remains unclear. We examined AMPAR-mediated currents in cerebellar stellate cells from stargazer mice, which lack the prototypical TARP stargazin (g-2). We found a marked increase in the contribution of CP-AMPARs to synaptic responses, indicating that, unlike CI-AMPARs, these can localize at synapses in the absence of g-2. In contrast with CP-AMPARs in extrasynaptic regions, synaptic CP-AMPARs displayed an unexpectedly low channel conductance and strong block by intracellular spermine, suggesting that they were ‘TARPless’. As a proof of principle that TARP association is not an absolute requirement for AMPAR clustering at synapses, miniature excitatory postsynaptic currents mediated by TARPless AMPARs were readily detected in stargazer granule cells following knockdown of their only other TARP, g-7.


Figures

Figure 1
Figure 1
Loss of γ-2 increases EPSC rectification in stellate cells. (a) AMPAR-mediated eEPSCs are strongly rectifying in stg/stg stellate cells. Representative PF-evoked synaptic currents in two stellate cells in cerebellar slices from a control mouse (left) and a stg/stg mouse (right). Currents are averaged responses at −80, −60, −40, 0 and +40 mV. (b) Corresponding I-V relationships normalized to −80 mV. The fitted curves are fifth-order polynomials. (c) Pooled data showing rectification index values determined as the ratio of synaptic conductance at +40 and −60 mV. Here, and in all figures, the box-and-whisker plots indicate the median value (red line), the 25-75th percentiles (box) and the 10-90th percentiles (whiskers); open circles show individual values. The rectification index is significantly less in stg/stg compared to control stellate cells (n = 8 cells from 5 animals and 9 cells from 4 animals, respectively; ** p < 0.01). (d) Rectification of stg/stg mEPSCs persists in presence of WT innervation. Representative recordings of mEPSCs from cultured stellate cells at −80 and +60 mV. Traces are from a control cell (top) and a stg/stg cell (bottom). Traces to the right show summed mEPSCs from equivalent time periods at the two voltages. (e) Global averages of normalized summed mEPSCs (5 control cells and 9 stg/stg cells from 2 cultures). Shaded areas denote s.e.m. (f) Pooled data showing rectification index values determined as the ratio of summed peak conductance at +60 and −80 mV. Open circles show individual values. The rectification index is significantly less in stg/stg compared to control cells (*** p < 0.001).
Figure 2
Figure 2
Amplitude and kinetic properties of qEPSCs in control and stg/stg stellate cells. (a) Representative qEPSCs evoked in a control stellate cell by PF stimulation (arrow) in the presence of 5 mM SrCl2. The period immediately following stimulation is enlarged in the lower panel. Synaptic events occurring >10 ms after stimulation, and exceeding the detection threshold (red dashed line), are indicated by arrowheads. (b) Amplitude distribution (open bars) of all selected events from the same cell as a. Background variance is indicated by the baseline all-point amplitude distribution (grey bars) fitted with a Gaussian. The inset shows the average qEPSC. (c and d) Same as a, for qEPSCs evoked in a stg/stg stellate cell. (e) Cumulative probability distributions for qEPSC amplitudes in control (blue) and stg/stg stellate cells (red). The averaged distributions are shown in bold with filled areas representing s.e.m. (f) Pooled data for qEPSC amplitudes and their coefficients of variation (CV) (n = 17 and 15 cells, from 14 and 13 animals; both *** p < 0.001). (g) Superimposed global mean control and stg/stg qEPSCs; shaded areas denote s.e.m. (h) Pooled data for rise-time and decay measures (n = 18 and 8; * p < 0.05).
Figure 3
Figure 3
Enhanced block by intracellular spermine and extracellular PhTx-433 of PF-evoked qEPSCs in stg/stg stellate cells. (a) qEPSCs recorded at −80 mV (left) and +60 mV (right) from a control stellate cell. Arrowheads indicate events occurring >10 ms after stimulation, and exceeding the detection threshold. Asterisks in the upper sweep denote events arising from apparent superimposition of two qEPSCs. (b) Equivalent traces recorded from a representative stg/stg stellate cell. (c) Pooled data showing voltage-dependent changes in qEPSC peak conductance in control and stg/stg stellate cells. Note the much smaller conductance at −80 mV of stg/stg compared to control qEPSCs (n = 6 and 5 cells, from 5 animals each; ** p < 0.01) and the significantly reduced conductance at +60 mV in control cells (n = 5; * p < 0.05). (d) Pooled data showing the greater depolarization-induced reduction in qEPSC frequency in stg/stg stellate cells (**p < 0.01). (e) Pooled data showing rectification index (see Methods). Note the significantly increased rectification in stg/stg stellate cells (** p < 0.01). (f) Time course of the effect of bath-applied PhTx-433 (10 μM) on qEPSC charge per PF stimulus in a representative control stellate cell. On the right, box-and-whisker plots of the charge transfer measured over time periods 1 and 2 (left, grey lines) before and after PhTx-433 application (*** p < 0.0001). (g) Time course of PhTx-433 action in a representative stg/stg stellate cell. Note the large fraction of failures in time period 2 and its dramatic effect on the qEPSC charge transfer per stimulus, right panel (*** p < 0.0001). (h-j) Pooled data showing the effect in control and stg/stg stellate cells of PhTx-433 on qEPSC charge per stimulus (n = 5 cells from 4 animals and 6 cells from 5 animals, respectively; * p < 0.05), qEPSC peak amplitude, and qEPSC frequency (** p < 0.01).
Figure 4
Figure 4
Single-channel conductance of synaptic AMPARs is reduced in stg/stg stellate cells. (a) PF-evoked qEPSCs recorded in a representative control stellate cell at −80mV. Individual events (thin grey traces) were aligned at their 10% rise time and averaged (thick blue line). The lower panel is a color-coded image of all events. (b) Corresponding current-variance relationship. The dashed line indicates the background current variance. The weighted-mean unitary current (i) and the number of channels open at the peak (Np) were estimated from the parabolic fit. (c and d) As for a and b, but for a representative stg/stg stellate cell. Note the typically smaller qEPSC amplitude. (e) Pooled data showing the reduced single-channel conductance in stg/stg stellate cells (n = 18 cells from 16 animals and 8 cells from 7 animals; ** p < 0.01).
Figure 5
Figure 5
Extrasynaptic AMPARs in stg/stg stellate cells exhibit increased rectification and large single-channel conductance. (a) Representative averaged current evoked by ultrafast application of 10 mM glutamate (100 ms) to an outside-out somatic patch (−60 mV) excised from a stellate cell in slices from a control mouse. Inset shows corresponding current-variance plot. Symbols denote mean variance in each of ten equally spaced amplitude bins. Vertical error bars denote s.e.m. The weighted-mean single-channel current (i) and the number of channels in the patch (N) are calculated from a weighted parabolic fit to the data. (b) As for a, but from a stg/stg stellate cell. (c) Pooled data showing the similar desensitization time course (τw, des) of the currents from control and stg/stg stellate cells (n = 11 cells from 9 animals and 8 cells from 6 animals). (d) Pooled data showing the greater rectification of extrasynaptic AMPARs in stg/stg stellate cells (n = 9 and 10 cells, from 7 animals each; * p < 0.05). Rectification index was calculated as the ratio of mean peak current amplitudes at +60 and −60 mV. (e) Pooled data showing the large single-channel conductance determined in both control and stg/stg stellate cells (n = 9 and 8 cells, from 7 and 5 animals).
Figure 6
Figure 6
Direct resolution of AMPAR channel events in outside-out somatic patches from control and stg/stg stellate cells. (a) Representative records showing resolved channel events in the tail of macroscopic responses (truncated) to rapid application of 1 mM glutamate. Responses were obtained at −60 mV and, for illustration, are filtered at 2 kHz. (b) Same as a but for a patch from a stg/stg stellate cell. (c) Representative all-point amplitude histograms, from the selected segments shown in the blue boxes in a, fitted with two Gaussian components, giving current estimates of 2.2 and 2.1 pA. Analysis was performed on records filtered at 4 kHz. (d) Pooled data for the same patch as a, showing the distribution of current amplitudes for 63 selected events in 273 sweeps. (e, f) Same as c and d, but from the stg/stg stellate cell patch shown in a (85 events in 174 sweeps). Individual histograms are from the selected segments shown in the red boxes. (g) Histograms and cumulative distributions of pooled data (n = 8 cells from 6 control animals and 7 cells from 6 stg/stg animals). Note that both control and stg/stg patches exhibit large conductance events. (h) Representative records from a stg/stg patch, showing prolonged large conductance openings at −60 mV but only brief flickering events at +60 mV, consistent with partial block by intracellular spermine of CP-AMPARs (records filtered at 4 kHz).
Figure 7
Figure 7
CNQX is not a partial agonist for CP-AMPARs containing TARP γ-7. (a) Bath application of 10 μM CNQX in the presence of 100 μM cyclothiazide (CTZ) (grey bar) evoked a whole-cell current in control stellate cells. Plot shows the time course of the response (−80 mV). Symbols represent the averaged whole-cell current from 3 cells (from 2 animals) and the error bars denote the s.e.m. (b) stg/stg stellate cells did not respond to CNQX (n = 3 cells from 2 animals). (c) Normalized representative currents evoked by ultrafast application of 1 mM glutamate (black bar), and 10 μM CNQX (grey bar; in presence of 100 μM CTZ), from somatic outside-out patches excised from tsA201 cells transfected with GluA1 alone (upper traces), GluA1 and γ-2 (middle traces) or GluA1 and γ-7 (lower traces). Note that CNQX evoked a detectable current only from the cell co-expressing GluA1 with γ-2. (d) Pooled data showing ratio of the peak amplitude of the currents (%) evoked by CNQX and glutamate for GluA1, GluA3 and GluA4, alone and with γ-2 or γ-7. For each GluA subunit, there was a significant difference between groups (one-way ANOVA), with the fractional CNQX-evoked current significantly larger with γ-2 than with the GluA subunit alone (* p < 0.05, ** p < 0.01) or with γ-7 (# p < 0.05, ## p < 0.01) (Tukey HSD multiple comparison of means).
Figure 8
Figure 8
shRNA knockdown of TARP γ-7 rescues synaptic transmission in stg/stg granule cells. (a) Representative whole-cell recordings (eight consecutive 1 s sweeps) from an untransfected stg/stg granule cell (left) and a stg/stg granule cell treated with shRNA against γ-7 (right). Recordings were obtained at −60 mV in the presence of 0.5 μM TTX. mEPSCs were seen in 0/5 granule cells from 1 stg/stg culture but in 25/27 cells from 2 shRNA treated cultures. (b) Superimposed mEPSCs (grey) and average record (black) for the shRNA-treated cell shown in a. (c) Scaled global average mEPSC from 14 shRNA-treated cells in which average mEPSCs were obtained from >20 events (21–406). Grey fill denotes s.e.m. The mean amplitude of the averaged mEPSCs was 11.6 ± 0.8 pA.

Similar articles

Cited by

References

    1. Traynelis SF, et al. Glutamate receptor ion channels: structure, regulation, and function. Pharmacol Rev. 2010;62:405–496. - PMC - PubMed
    1. Chen L, et al. Stargazin regulates synaptic targeting of AMPA receptors by two distinct mechanisms. Nature. 2000;408:936–943. - PubMed
    1. Kato AS, et al. New transmembrane AMPA receptor regulatory protein isoform, gamma-7, differentially regulates AMPA receptors. Journal of Neuroscience. 2007;27:4969–4977. - PMC - PubMed
    1. Soto D, et al. Selective regulation of long-form calcium-permeable AMPA receptors by an atypical TARP, gamma-5. Nat Neurosci. 2009;12:277–285. - PMC - PubMed
    1. Tomita S, et al. Functional studies and distribution define a family of transmembrane AMPA receptor regulatory proteins. Journal of Cell Biology. 2003;161:805–816. - PMC - PubMed

Publication types