. 2012 Jun;158A(6):1368-80.
doi: 10.1002/ajmg.a.35346. Epub 2012 May 11.

The face signature of fibrodysplasia ossificans progressiva

Affiliations

The face signature of fibrodysplasia ossificans progressiva

Peter Hammond et al. Am J Med Genet A. 2012 Jun.

Abstract

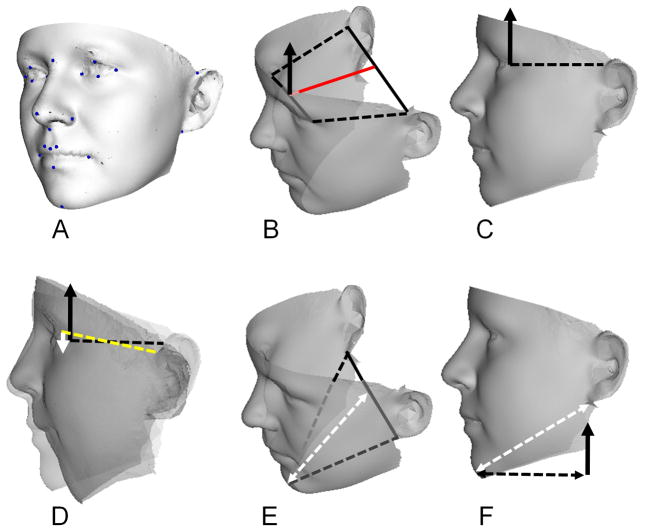
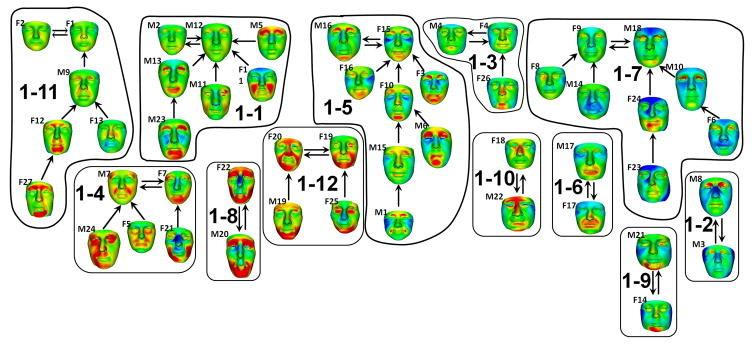
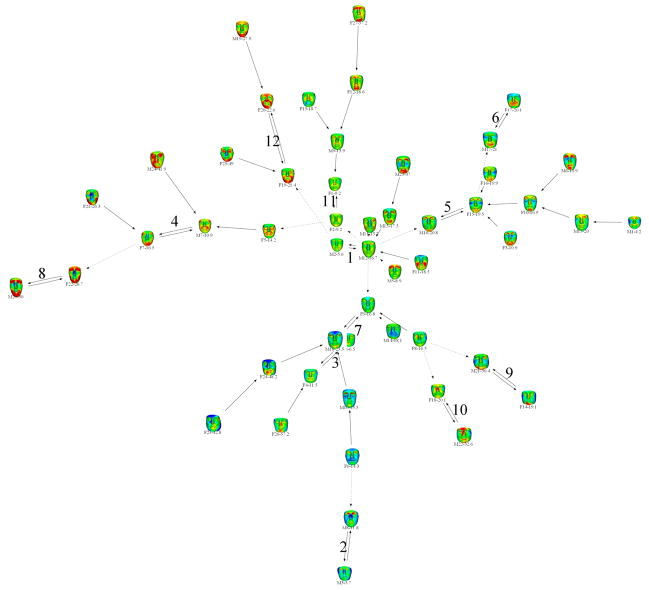
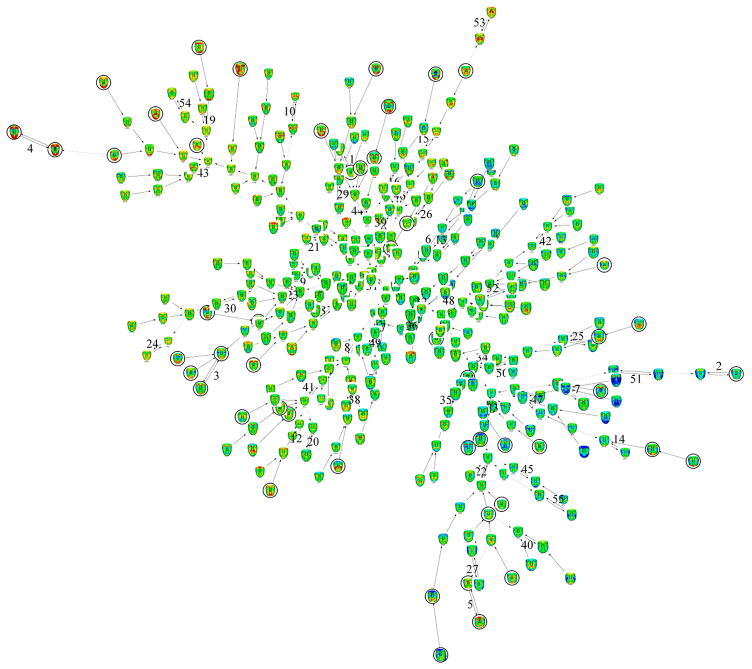
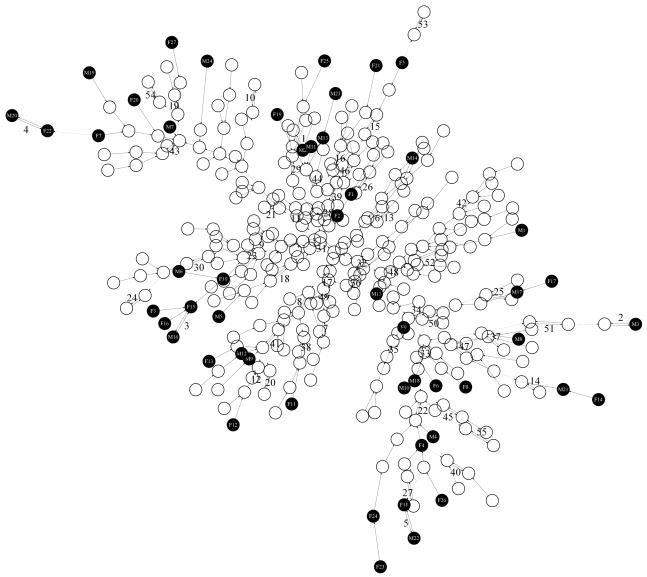
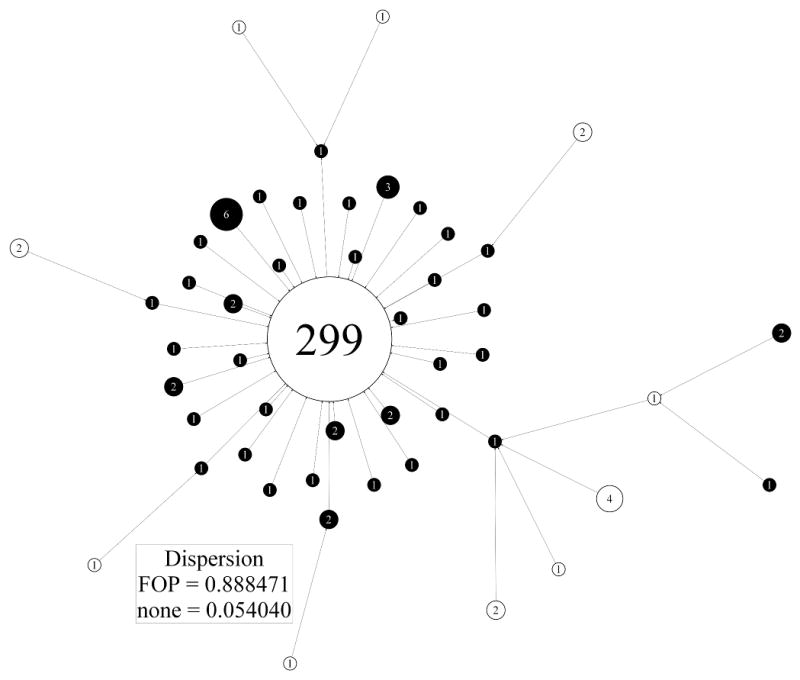
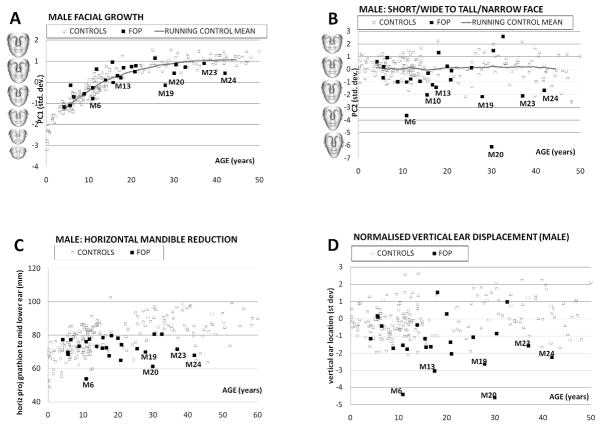
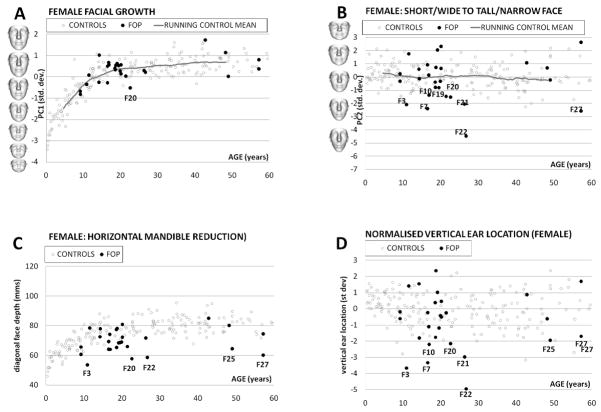
Fibrodysplasia ossificans progressiva (FOP) causes extensive heterotopic bone formation due to heterozygous mutations in the glycine-serine activation domain of ACVR1 (ALK2), a bone morphogenetic protein type I receptor. Anecdotal observations of facial similarity have been made by clinicians and parents, but no objective quantitative analysis of the faces of FOP patients has ever been undertaken. We delineated the common facial characteristics of 55 individuals with molecularly confirmed FOP by analyzing their face signature (face shape difference normalized against age and sex matched controls) and associated face signature graphs (with face signatures as vertices and adjacency corresponding to greatest similarity). Our analysis identified 10 affected individuals whose face signature is more homogeneous than others with FOP. This distinct subgroup showed the previously identified reduced mandible as well as newly identified features: underdevelopment of the upper orbit/supra-orbital ridge; infra-orbital prominence; and, low-set ears. These findings strongly suggest that the canonical FOP mutation variably affects the postnatal morphogenesis of the normotopic cranial skeleton in the upper midface and mandible and may have important diagnostic and functional implications.


Figures

Figure 1
Figure 1
A: Landmarks used in dense surface model construction; B and C: construction of reference normal (black arrow) to plane containing line exocanthion-exocanthion and reference line (red) joining mid-points of exocanthion-exocanthion and preaurale-preaurale; D: estimate of vertical displacement (white arrow) of preaurale-preaurale for an individual compared to the overall same-sex mean control (projection of broken red line on to black arrowed line); E and F: construction of diagonal face depth (double arrowed white line) to estimate mandibular underdevelopment.
Figure 2
Figure 2
Face signature clusters of FOP patients
Figure 3
Figure 3
Face signature graph for FOP patients
Figure 4
Figure 4
Face signature graph for controls and FOP patients
Figure 5
Figure 5
Colored coded version of face signature graph for controls and FOP patients
Figure 6
Figure 6
Collapsed version of face signature graph for controls and FOP patients. Control and FOP signatures are shown respectively as empty and black filled circles
Figure 7
Figure 7
A: For DSMmale, PC1 (in standard deviations) is plotted against age (in years). The PC1 axis is annotated with the model’s mean face morphed to its shape at −3, 0 and +3 st devs. A running mean value of PC1 for 50 consecutively aged controls approximates mean facial growth (continuous grey line). Outliers are labelled. B: For DSMmale, PC2 (in standard deviations) is plotted against age (in years). The PC1 axis is annotated with the model’s mean face morphed to its shape at −5, −3, 0 and +3 st devs. A running mean value of PC2 for 50 consecutively aged controls approximates mean facial growth (continuous grey line). C: For DSMmale, horizontal mandible reduction is plotted against age (in years). Outliers are labelled. D: Normalized male vertical ear displacement (std. dev.) is plotted against age (years). Outliers are labelled.
Figure 8
Figure 8
A: For DSMfemale, PC1 (in standard deviations) is plotted against age (in years). The PC1 axis is annotated with the model’s mean face morphed to its shape at −3, 0 and +3 st devs. A running mean value of PC1 for 50 consecutively aged controls approximates mean facial growth (continuous grey line). Outliers are labelled. B: For DSMfemale, PC2 (in standard deviations) is plotted against age (in years). The PC1 axis is annotated with the model’s mean face morphed to its shape at −5, −3, 0 and +3 st devs. A running mean value of PC2 for 50 consecutively aged controls approximates mean facial growth (continuous grey line). C: For DSMfemale, horizontal mandible reduction is plotted against age (in years). Outliers are labelled. D: Normalized female vertical ear displacement (std. dev.) is plotted against age (years). Outliers are labelled.

Comment in

References

    1. Bhuiyan Z, Klein M, Hammond P, Mannens MMAM, van Berckelaer-Onnes I, Hennekam RCM. Phenotype-genotype correlations in Cornelia de Lange Syndrome: the Dutch experience. J Med Genet. 2006;43:568–575. - PMC - PubMed
    1. Butts SC. The facial phenotype of the velo-cardio-facial syndrome. Int J Ped Otorhinolaryn. 2009;73:343–350. - PubMed
    1. Carvalho DR, Farage L, Martins BJAF, Speck-Martins CE. Craniofacial findings in fibrodysplasia ossificans progressiva: computerized tomography evaluation. Oral Surg Oral Med Oral Pathol Oral Radiol Endod. 2011:499–502. - PubMed
    1. Chakkalakal SA, Zhang D, Culbert A, Wright AC, Maidment ADA, Kaplan FS, Shore EM. The ACVR1 (R206H) mutation recapitulatesthe clinical phenotype of FOP in a knock-in mouse model. J Bone Miner Res. 2010;25(Suppl 1):S4.
    1. Chatterjee S, Kraus P, Lufkin T. A symphony of inner ear developmental control genes. BMC Genetics. 2010;11:68. - PMC - PubMed

Publication types