. 2012 Aug;101(8):2763-76.
doi: 10.1002/jps.23180. Epub 2012 May 11.

Physicochemical properties of epidermal growth factor receptor inhibitors and development of a nanoliposomal formulation of gefitinib

Affiliations

Physicochemical properties of epidermal growth factor receptor inhibitors and development of a nanoliposomal formulation of gefitinib

Brian J Trummer et al. J Pharm Sci. 2012 Aug.

Abstract

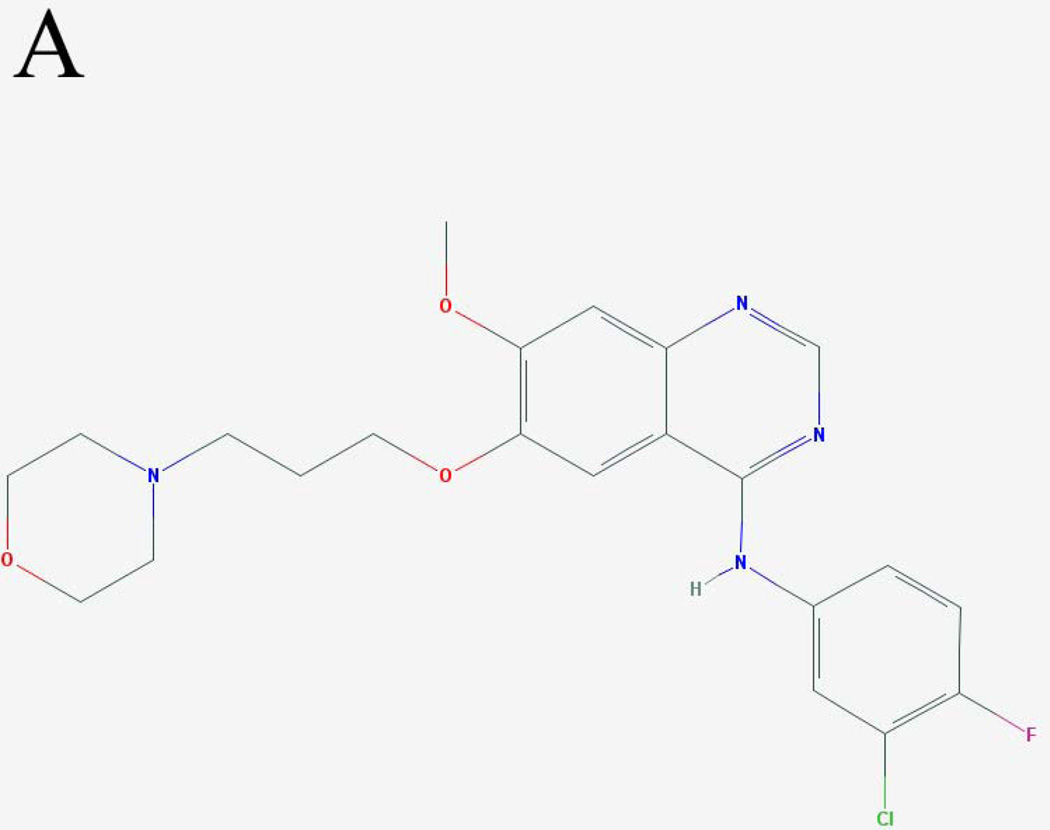
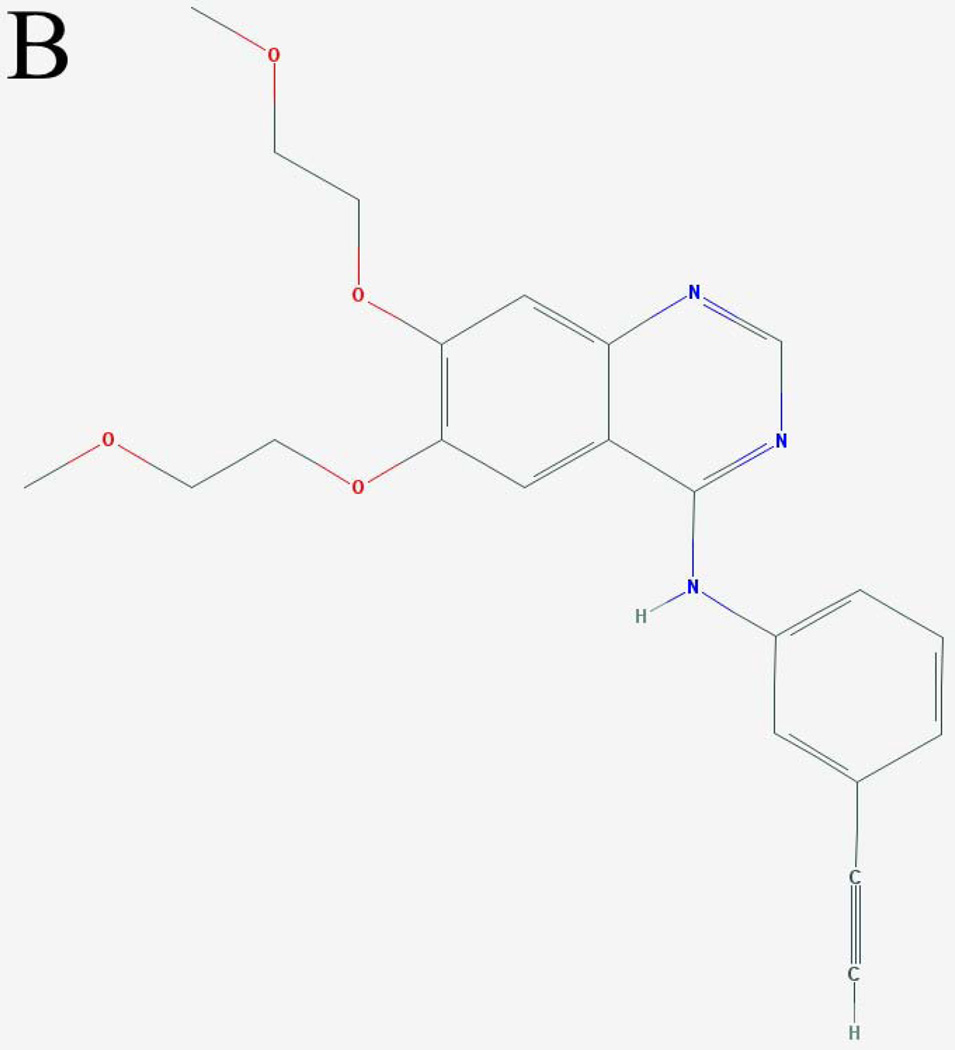
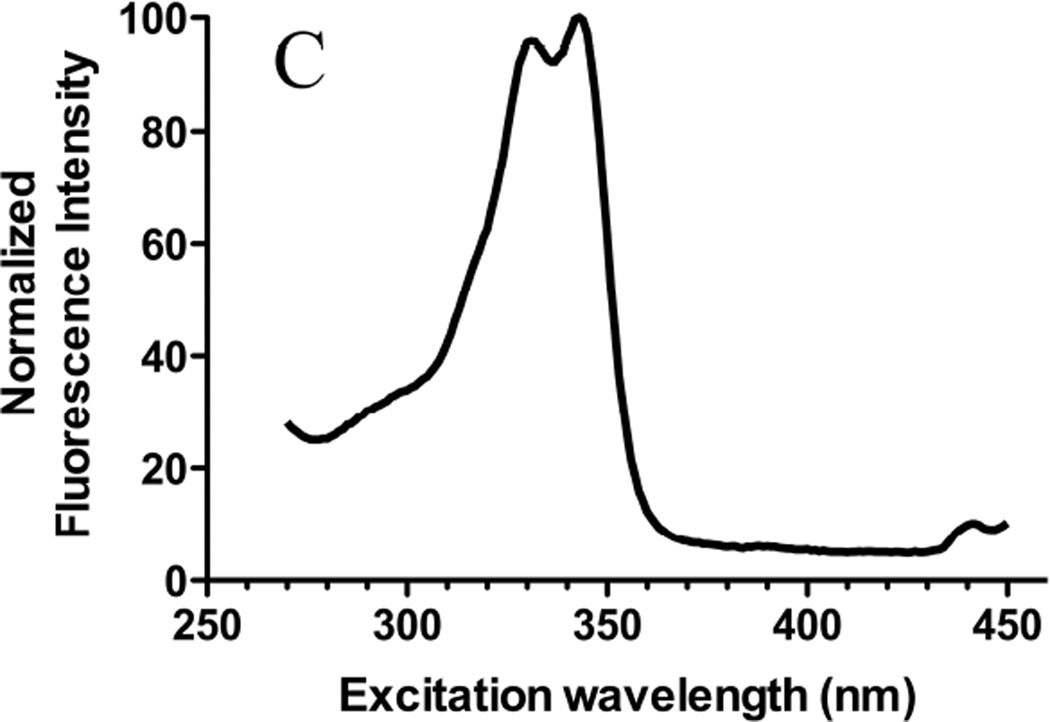
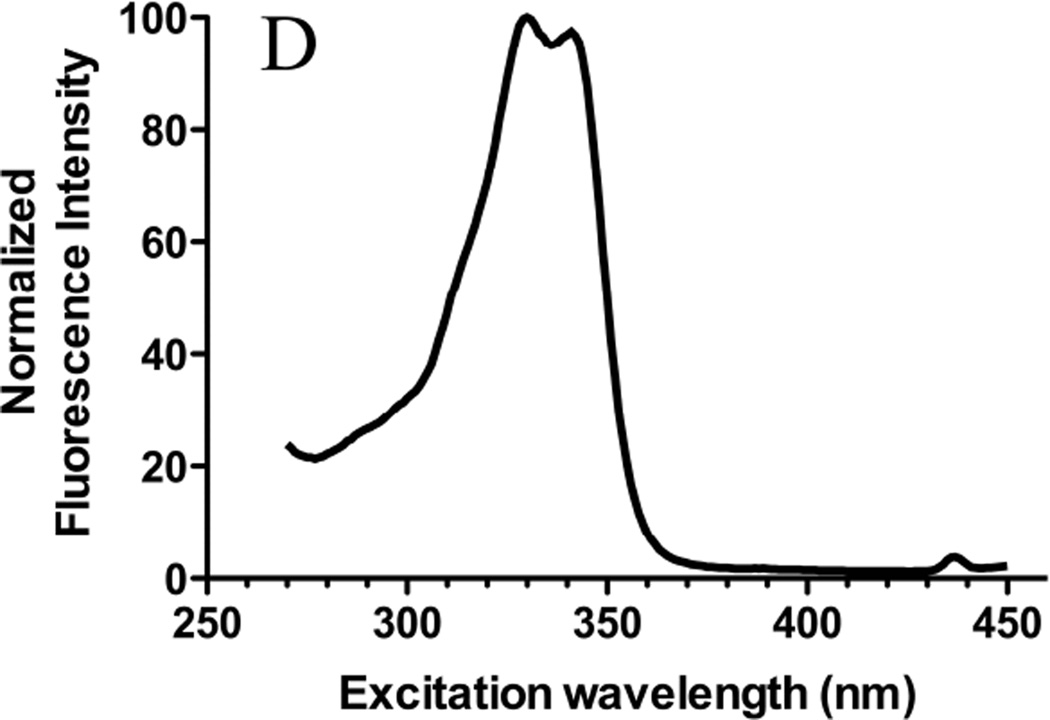
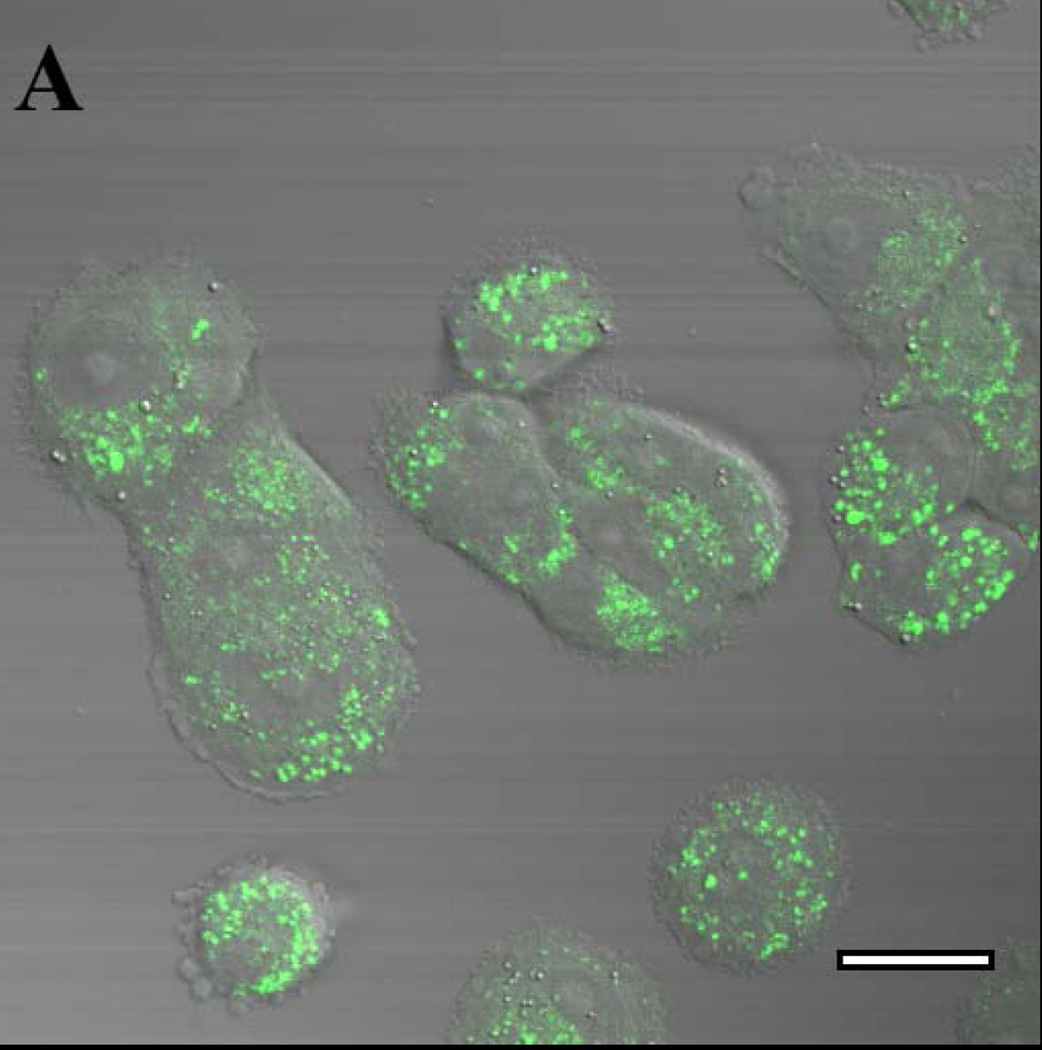
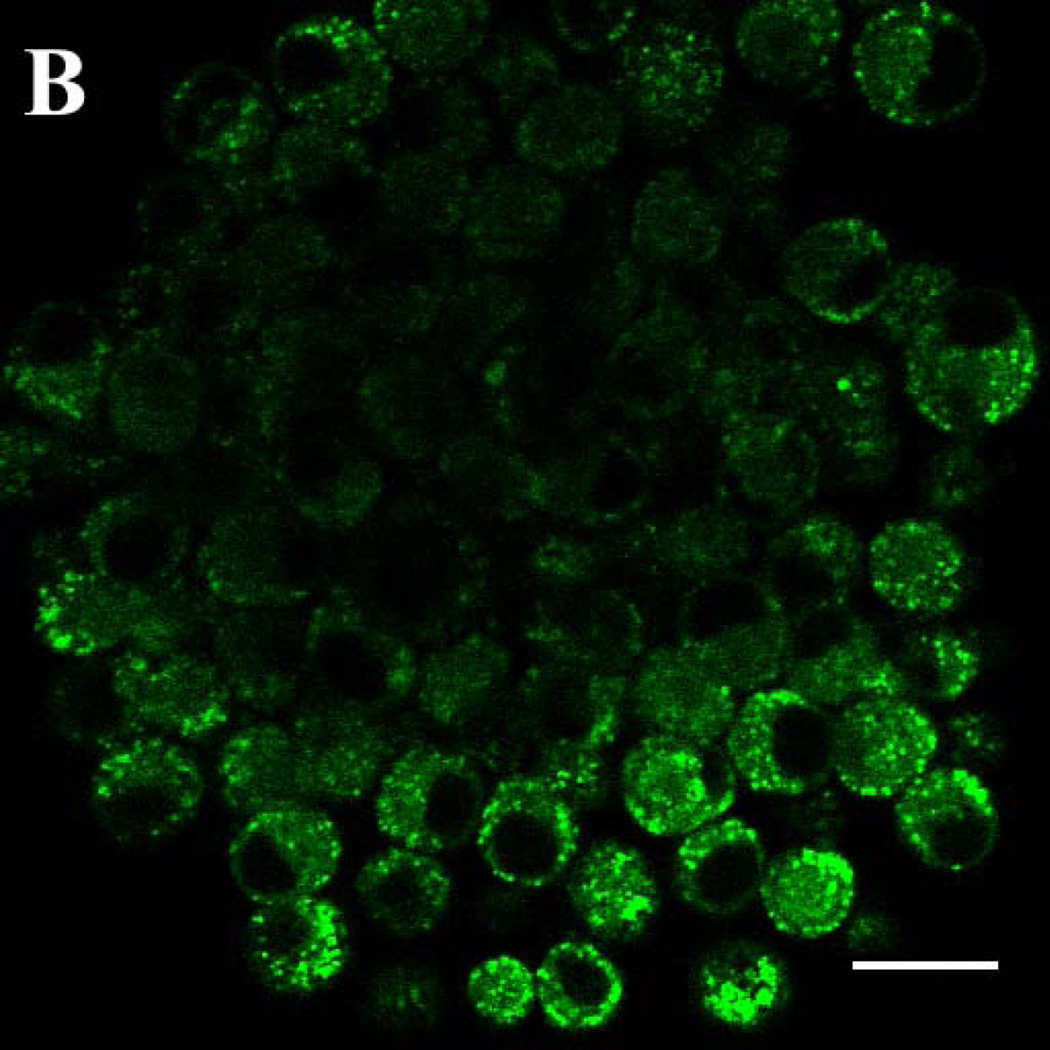
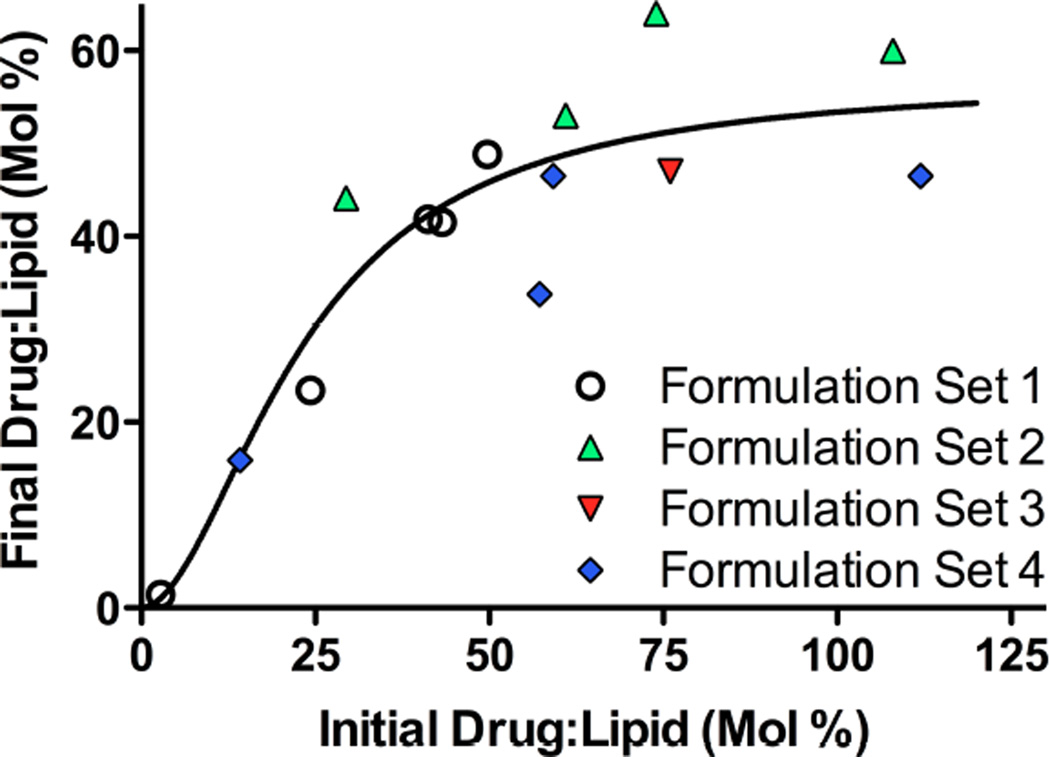
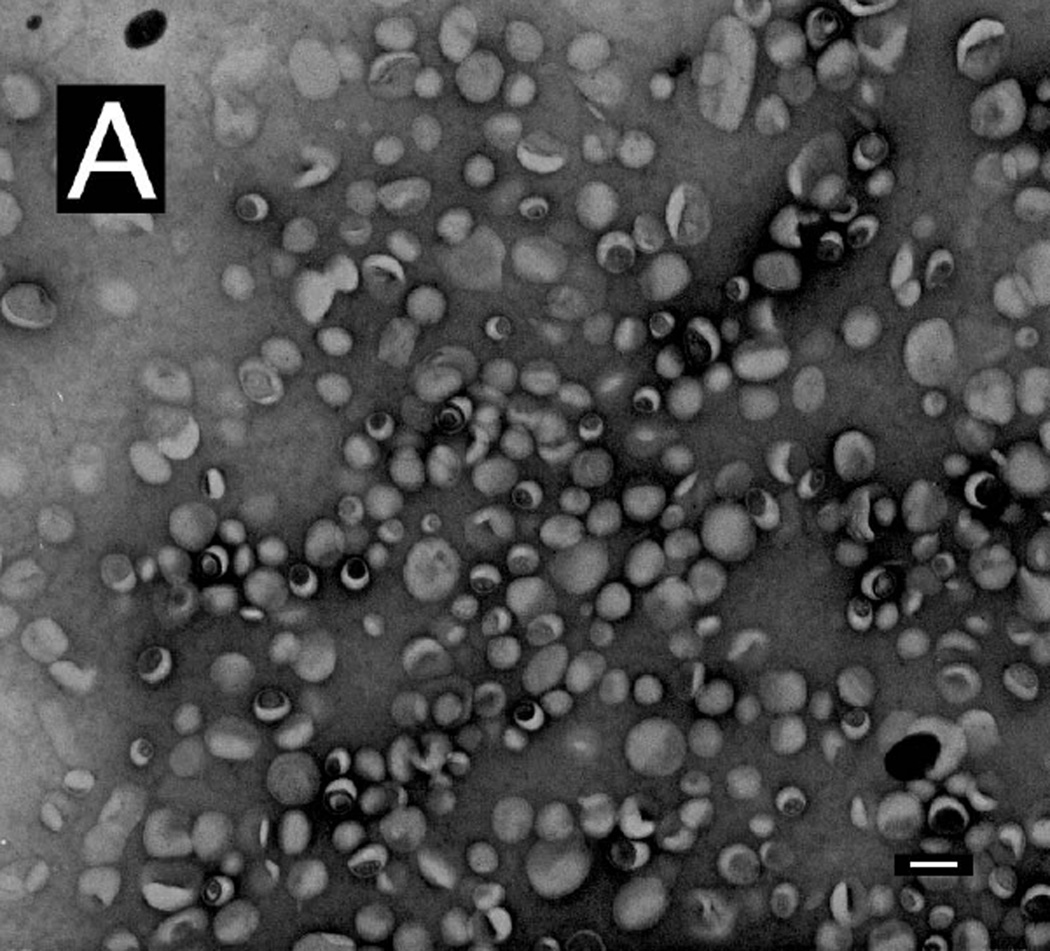
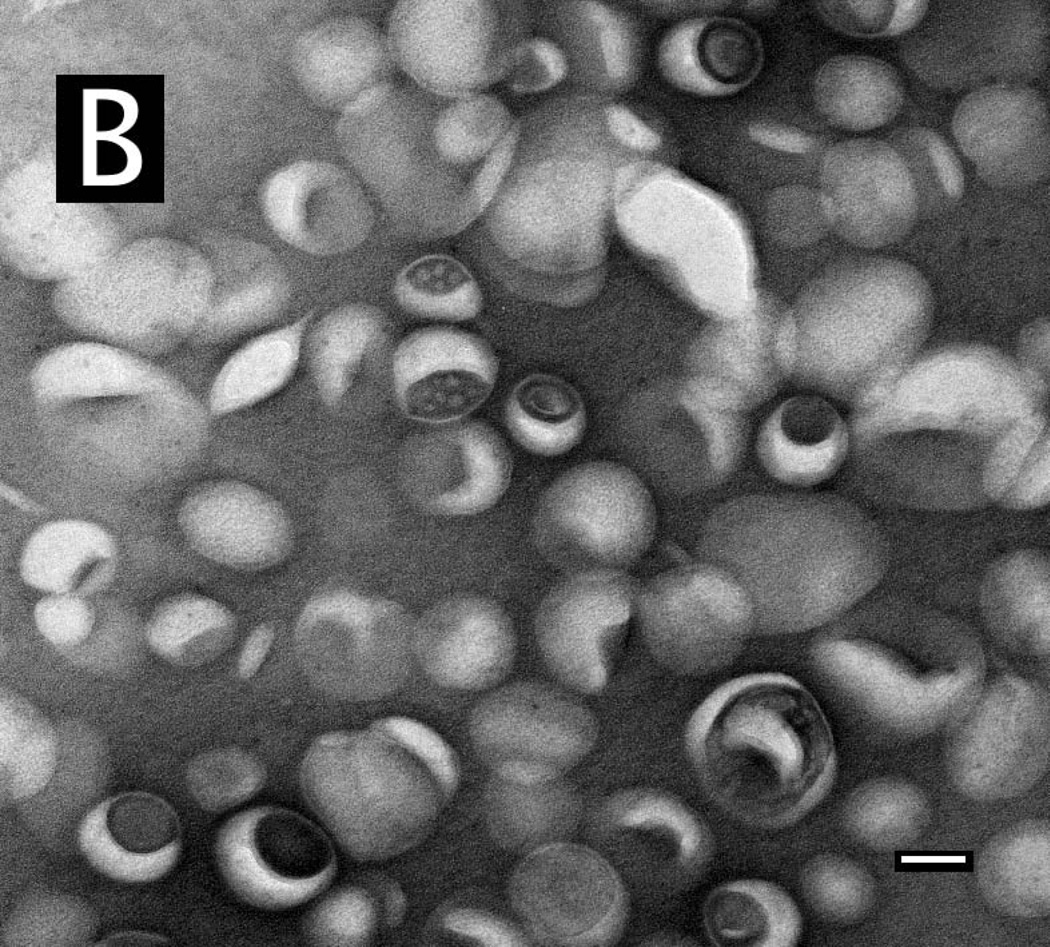
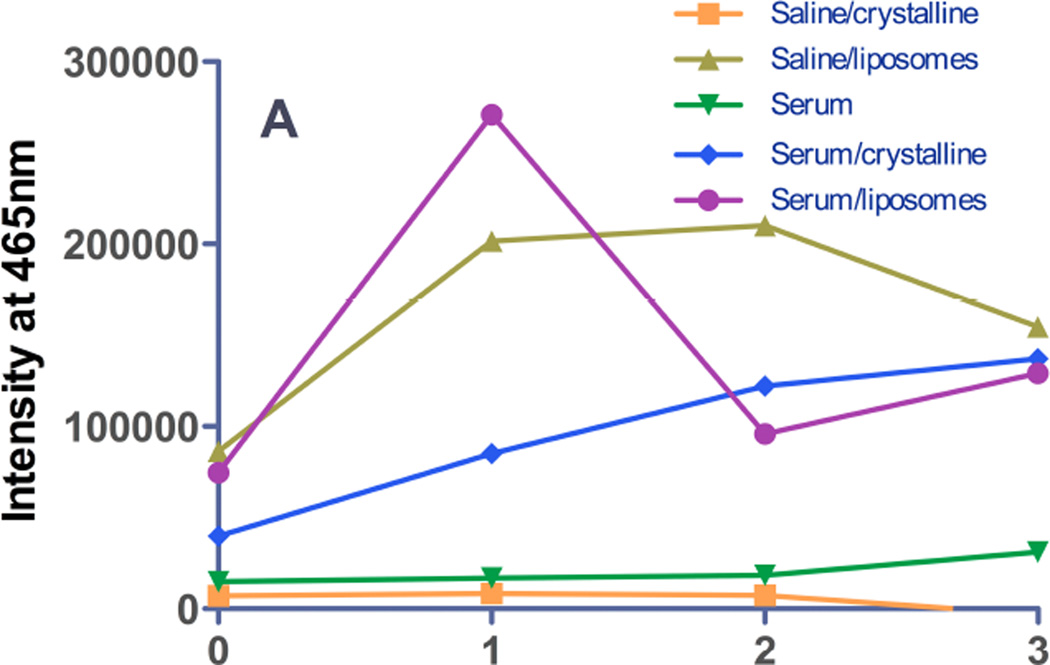
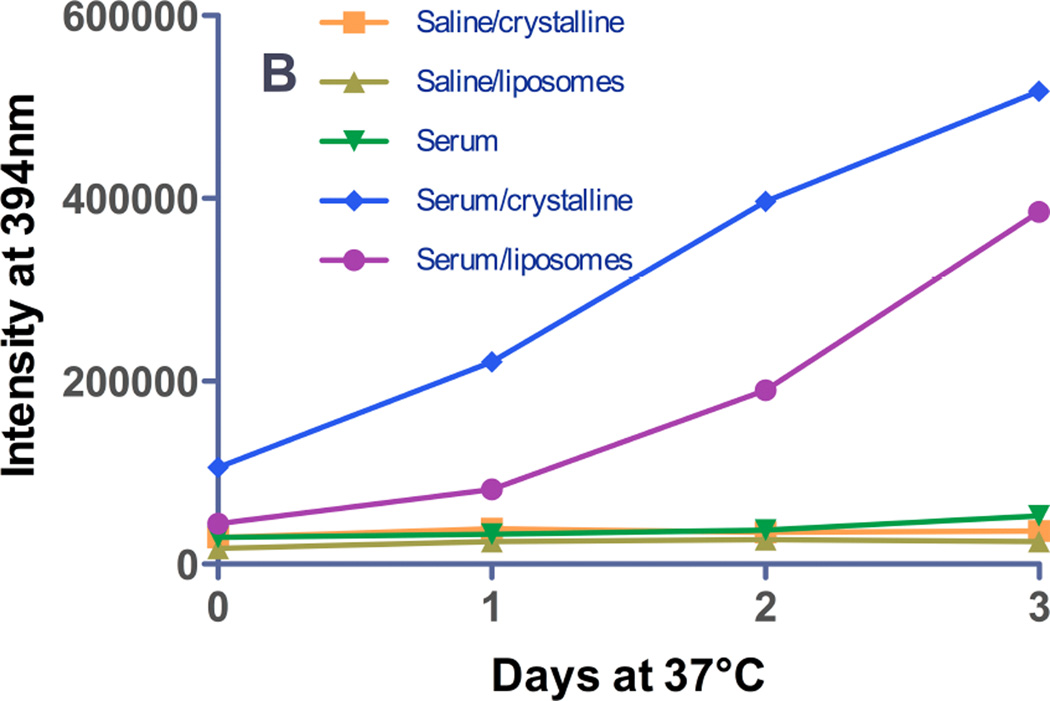
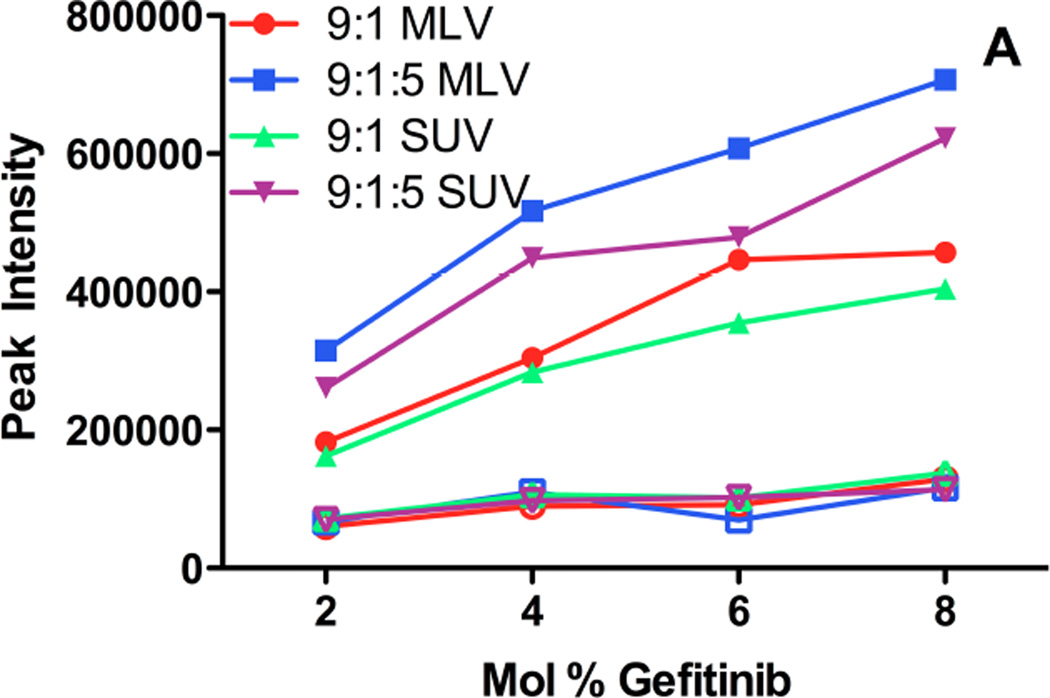
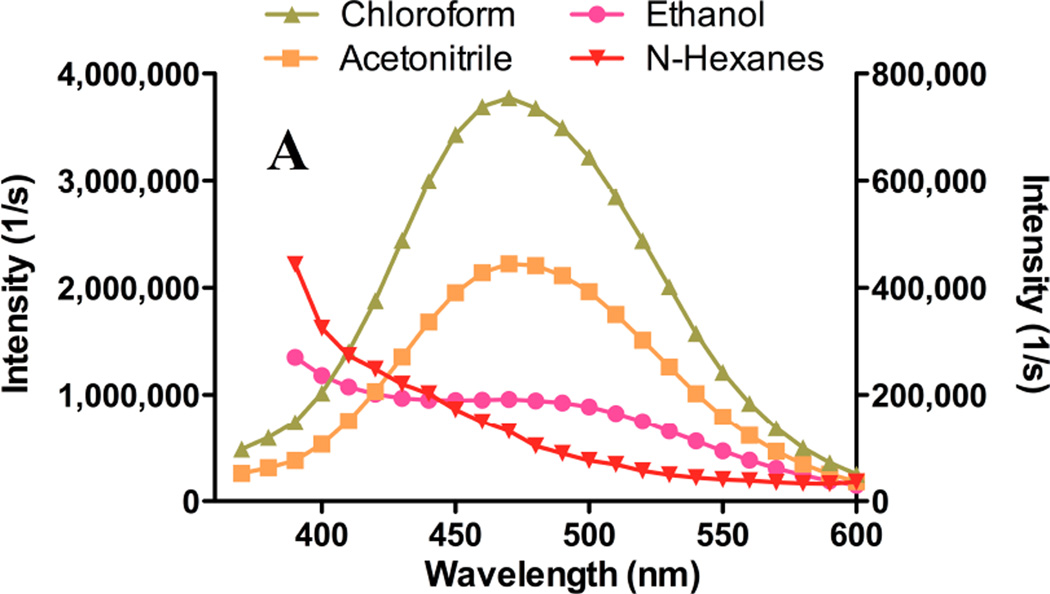
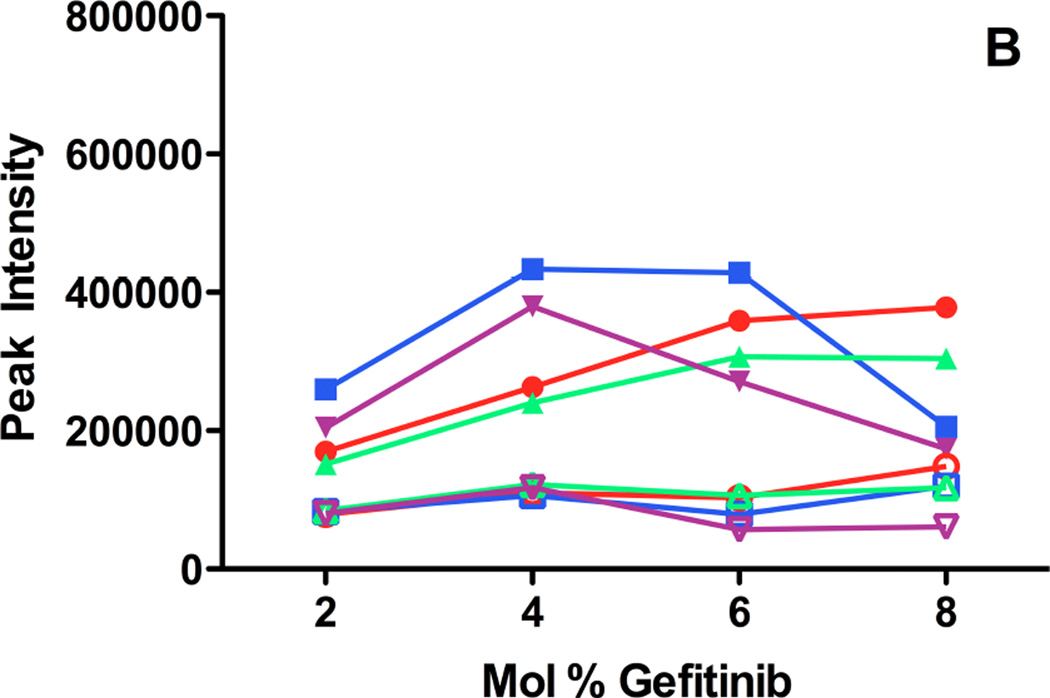
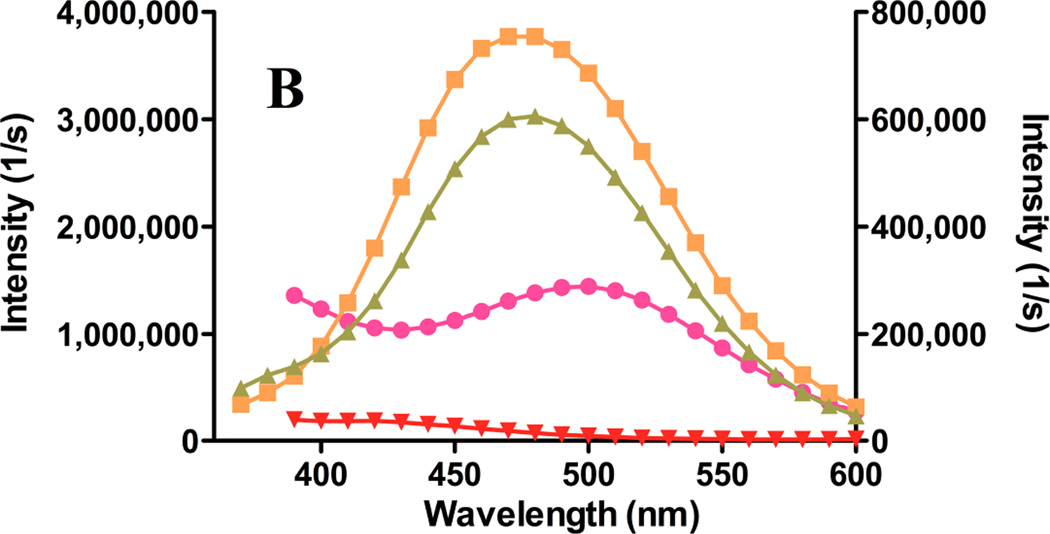
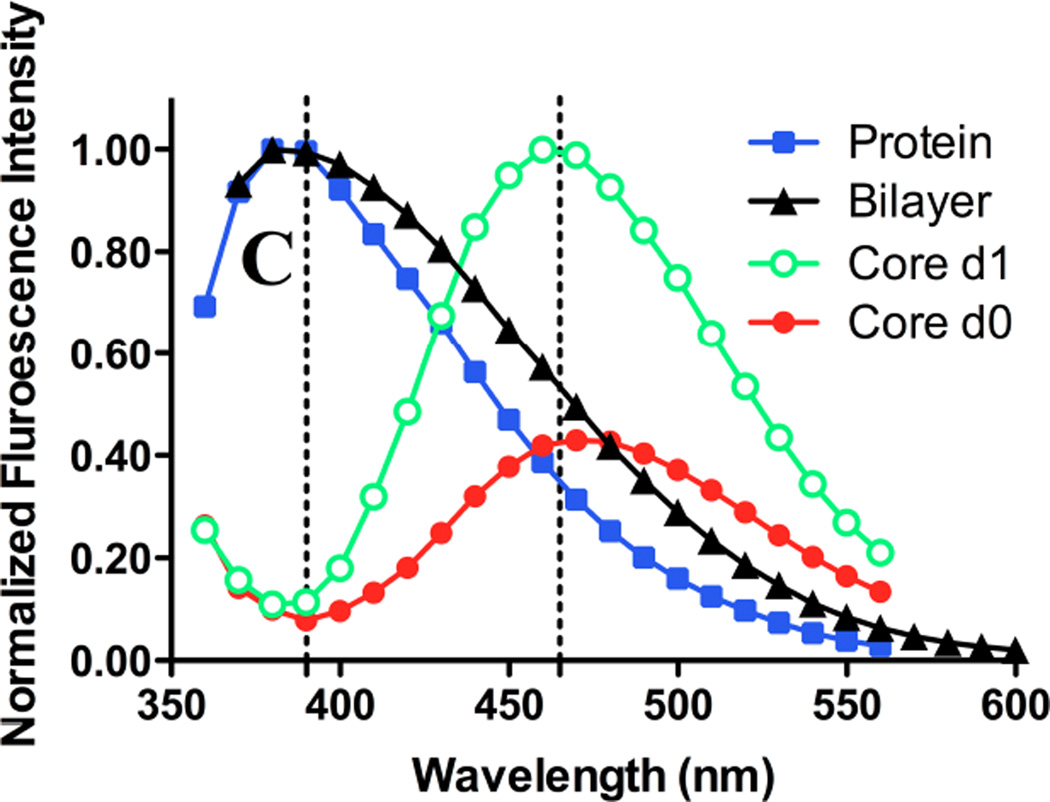
Inhibitors of epidermal growth factor (EGF) receptor (EGFR) tyrosine kinases show efficacy in cancers that are highly addicted to nonmutated EGF signaling, but off-target effects limit therapy. Carrier-based formulations could reduce drug deposition in normal tissues, enhance tumor deposition, and reduce free drug concentrations, thereby reducing the side effects. Therefore, the feasibility of developing nanoliposomal formulations of EGFR inhibitors was investigated. Gefitinib and erlotinib fluorescence was characterized as a tool for formulation development. Peak excitation was 345 nm and peak emission was 385-465 nm, depending upon the environment polarity. Emission was negligible in water but intense in nonpolar solvents, membranes, or bound to serum proteins. Cellular uptake and distribution could also be imaged by fluorescence in drug-resistant tumor spheroids. Gefitinib fluorescence characteristics enabled facile optimization of formulations. Although 4-6 mol % gefitinib could be incorporated in the liposome bilayer, 40-60 mol % could be encapsulated in stable, remote-loaded liposomes consisting of distearoylphosphatidylcholine-polyethylene glycol-distereoylphosphatidylethanolamine-cholesterol (9:1:5 mol:mol:mol). Drug leakage in serum, monitored by fluorescence, was minimal over 24 h at 37°C. The results provide both promising lead formulations as well as novel tools for evaluating new formulations of structurally similar receptor tyrosine kinase inhibitors and their cellular uptake and tissue biodistribution.


Figures

Figure 1
Figure 1. Molecular structures and excitation spectra of gefitinib and erlotinib
The molecular structures of (A) gefitinib (entry CID 123631) and (B) erlotinib (entry CID 176870) obtained from the PubChem compound database (http://www.ncbi.nlm.nih.gov/pccompound/). Normalized excitation spectra in n-hexanes of 15 µM (C) gefitinib and (D) erlotinib. Emission wavelength was 500 nm.
Figure 2
Figure 2. Solvent-dependent fluorescence emission spectra of gefitinib and erlotinib
Gefitinib or erlotinib were suspended at 15 µM in a variety of solvents, and fluorescence emission spectra were acquired. Excitation was at 340 nm. Spectra are uncorrected for the concentration of drug in solution. (A) Spectra of gefitinib in chloroform (triangles) or acetonitrile (filled squares); left ordinate indicates intensity scale. Scale on right ordinate for gefitinib in ethanol (filled circles) or n-hexanes (inverted triangles) is expanded to demonstrate red- and blue shifts. No detectable emission peak was observed for gefitinib in Tris-buffered saline (not shown). (B) Emission spectra of erlotinib in various solvents; symbols, axis scales are the same as in (A). No detectable emission peak was observed for erlotinib in Tris-buffered saline. (C) Normalized emission spectra of gefitinib. Filled squares: 20 µM drug in Tris-buffered saline with 10% newborn calf serum; the peak was 390 nm. Filled triangles: spectrum of 15 µM gefitinib incorporated in bilayer of liposomes composed of DSPC:PEG-DSPE (9:1 mol:mol); peak was 380 nm. No emission was observed for blank liposomes (not shown). Filled circles: fluorescence of 15 µM gefitinib encapsulated in the liposome core by remote loading in DSPC:PEG-DSPE:Chol (9:1:5 mol:mol:mol) liposomes immediately after dilution into TBS or (open circles) 1d after incubation at 37°C in TBS; the emission peak was 460 nm. The day-1 spectrum (open cirles) was normalized to the emission peak. The day-0 spectrum (filled circles) is shown in its original intensity relative to the day-1 spectrum.
Figure 3
Figure 3. Drug accumulation in 9L tumor spheroids imaged by dual-photon excitation confocal microscopy
Confocal laser scanning microscopy with multi-photon excitation was used to image cell-associated gefitinib, irradiating with a 700 nm laser line (350 nm excitation) and an emission band of 390–465 nm. (A) MCF7 human breast cancer cells incubated in monolayer culture for 18 h with 2 µM free gefitinib. (B) Spheroids of rat 9L brain tumor cells grown in a serum-free Neural Stem Cell medium supplemented with EGF and other components and incubated for 18 h with 10 µM free gefitinib, which approximates its IC50. The images are false-colored to represent gefitinib as green. Bar: 20 micrometers.
Figure 4
Figure 4. Fluorescence emission intensity as a function of gefitinib mole fraction added to liposomes of various composition
Fluid (low phase transition) or solid (high phase transition) liposomes, with or without 50 mol% cholesterol (9:1:5 mol:mol:mol), were prepared with varying mole fractions of gefitinib incorporated into the bilayer during liposome preparation (Methods). A portion of each MLV preparation was extruded through 80 nm polycarbonate filters to produce SUV. The fluorescence intensity was measured at the peak emission wavelength either immediately after preparation (A) or after 12 days of incubation at 4°C (B). The excitation wavelength was 320 nm to reduce light scattering contributions. (A) Fluorescence intensity of gefitinib in fluid (filled symbols) or solid (open symbols) liposome formulations as a function of the initial drug:lipid mole ratio, measured immediately after preparation. Filled circles: MLV of ePC:PEG-DSPE (9:1 mol:mol); filled squares: MLV of ePC:PEG-DSPE:Chol (9:1:5 mol:mol:mol); filled triangles: SUV of ePC:PEG-DSPE; filled inverted triangles: SUV of ePC:PEG-DSPE:Chol. Open circles: MLV of DSPC:PEG-DSPE (9:1 mol:mol); open squares: MLV of DSPC:PEG-DSPE:Chol (9:1:5 mol:mol:mol); open triangles: SUV of DSPC:PEG-DSPE; open inverted triangles: SUV of DSPC:PEG-DSPE:Chol. (B) Fluorescence intensity of gefitinib in fluid (filled symbols) or solid (open symbols) liposome formulations after 12 days of incubation at 4°C; symbols are the same as in (A). Light scattering contributed somewhat to the signal for formulations prepared with 8 mol% drug , which were highly aggregated.
Figure 5
Figure 5. Maximum capture of gefitinib in remote-loaded liposomes
The efficiency, maximum capacity, and reproducibility of gefitinib encapsulation in DSPC:PEG-DSPE:Chol (9:1:5 mol:mol:mol) liposomes by remote loading was evaluated for 4 sets of formulations differing in initial drug:lipid ratio (0.20–1.30 mol:mol) that were prepared over a period of 5 mos. Ammonium sulfate was the intra-luminal trapping ion. After loading, free drug was removed by dialysis and brief centrifugation (6 min, 7500g) to ensure formulations were free of precipitated drug. Gefitinib was quantified based on absorbance values at 345 nm by comparison to a standard curve after dissolution of the liposomes in 1:1 (v/v) chloroform:methanol. Phospholipid concentrations were determined by inorganic phosphate assay after digestion in sulfuric acid . Symbols represent the final drug:lipid ratio achieved (ordinate) at different initial drug:lipid loading ratios (abscissa). The solid line shows fitting of the data using a Hill function (WinNonlin®, Pharsight Inc., St. Louis, MO). The curve fitting indicated that the liposome capacity for drug asymptotically approached a maximum of 57 mol% (drug:lipid), with a standard error of 9%.
Figure 6
Figure 6. Transmission electron microscopy of remote-loaded liposomes
Remote-loaded liposomes of DSPC:PEG-DSPE:Chol (9:1:5 mol:mol:mol) were dialyzed and centrifuged for 6 min at 7500g. The final drug:lipid ratio was 0.60 mol:mol. Liposomes remaining in the supernatant were diluted in buffered saline and examined by TEM after negative staining in uranyl acetate. (A) Examination of multiple fields showed that the preparation was free of precipitated drug. Bar: 100 nm. (B) Higher-magnification image of the liposome formulation from panel (A), showing apparent electron-dense material associated with structures that appear to be liposomes. Bar: 50 nm.
Figure 7
Figure 7. Release of gefitinib from remote-loaded liposomes
Gefitinib fluorescence from remote-loaded liposomes of DSPC:PEG-DSPE:Chol (9:1:5 mol:mol:mol) during incubation 37°C in the presence or absence of serum was monitored at intervals over several days. The excitation wavelengths were 465 nm (A), a spectral band unique to drug precipitated in the liposome core, and 320 nm (B) the spectral band in which protein-bound drug fluoresces. On day 0, freshly-prepared liposomes were diluted to a final concentration of 20 µM in TBS or in TBS containing 10% newborn calf serum, and incubated at 37°C. An equivalent amount of free crystalline free drug was also incubated under the same conditions in order to estimate effect of drug dissolution rate on the rate of fluorescence signal change if 100% of the drug were present as a precipitate in the liposome formulations. (A) Gefitinib intensity at 465 nm, the peak wavelength characteristic of drug within the aqueous core of remote-loaded liposomes. Squares: crystalline free gefitinib in Tris-buffered saline; triangles: liposomal gefitinib in Tris-buffered saline; diamonds: crystalline gefitinib in serum-containing buffer; circles: liposomal gefitinib in serum-containing buffer; inverted triangles: serum-containing buffer without drug. The progressively increasing intensity from crystalline gefitinib in serum-containing buffer represents a spectral shoulder of the serum-bound drug emission peak at 394 nm, which was intense by day 2–3. (B) Gefitinib intensity at 394 nm, which is the peak wavelength of protein-bound drug. Symbols are the same as in (A). For experiments in which drug fluorescence was measured in serum-containing buffer, a standard curve consisting of known amounts of gefitinib added from a concentrated DMSO stock to the identical buffer was prepared, to ensure that fluorescence varied linearly with the concentration of released (free) gefitinib.

Similar articles

Cited by

References

    1. Rocha-Lima CM, Soares HP, Raez LE, Singal R. EGFR targeting of solid tumors. Cancer Control. 2007;14(3):295–304. - PubMed
    1. Wakeling AE, Guy SP, Woodburn JR, Ashton SE, Curry BJ, Barker AJ, Gibson KH. ZD1839 (Iressa): an orally active inhibitor of epidermal growth factor signaling with potential for cancer therapy. Cancer Res. 2002;62(20):5749–5754. - PubMed
    1. Paez JG, Janne PA, Lee JC, Tracy S, Greulich H, Gabriel S, Herman P, Kaye FJ, Lindeman N, Boggon TJ, Naoki K, Sasaki H, Fujii Y, Eck MJ, Sellers WR, Johnson BE, Meyerson M. EGFR mutations in lung cancer: correlation with clinical response to gefitinib therapy. Science. 2004;304(5676):1497–1500. - PubMed
    1. Lynch TJ, Bell DW, Sordella R, Gurubhagavatula S, Okimoto RA, Brannigan BW, Harris PL, Haserlat SM, Supko JG, Haluska FG, Louis DN, Christiani DC, Settleman J, Haber DA. Activating mutations in the epidermal growth factor receptor underlying responsiveness of non-small-cell lung cancer to gefitinib. N Engl J Med. 2004;350(21):2129–2139. - PubMed
    1. Guo A, Villen J, Kornhauser J, Lee KA, Stokes MP, Rikova K, Possemato A, Nardone J, Innocenti G, Wetzel R, Wang Y, MacNeill J, Mitchell J, Gygi SP, Rush J, Polakiewicz RD, Comb MJ. Signaling networks assembled by oncogenic EGFR and c-Met. Proc Natl Acad Sci U S A. 2008;105(2):692–697. - PMC - PubMed

Publication types

MeSH terms