. 2012 May 11;336(6082):740-3.
doi: 10.1126/science.1217283.

Recent explosive human population growth has resulted in an excess of rare genetic variants

Affiliations

Recent explosive human population growth has resulted in an excess of rare genetic variants

Alon Keinan et al. Science. .

Abstract

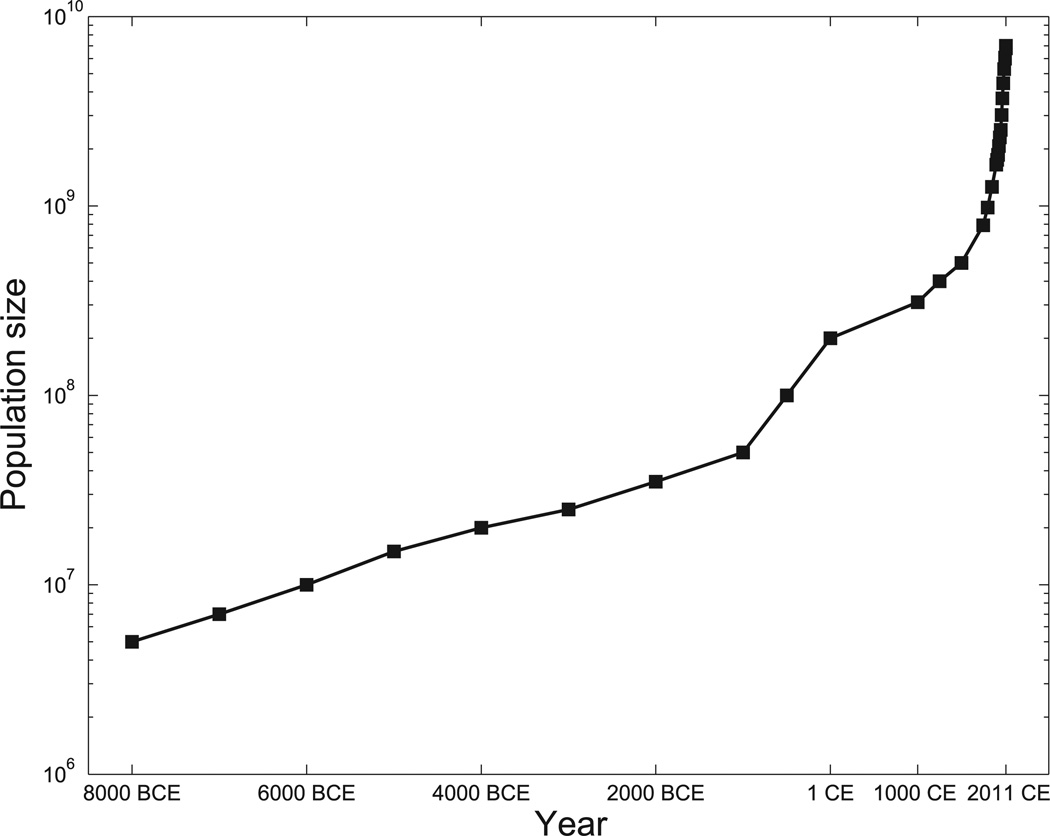
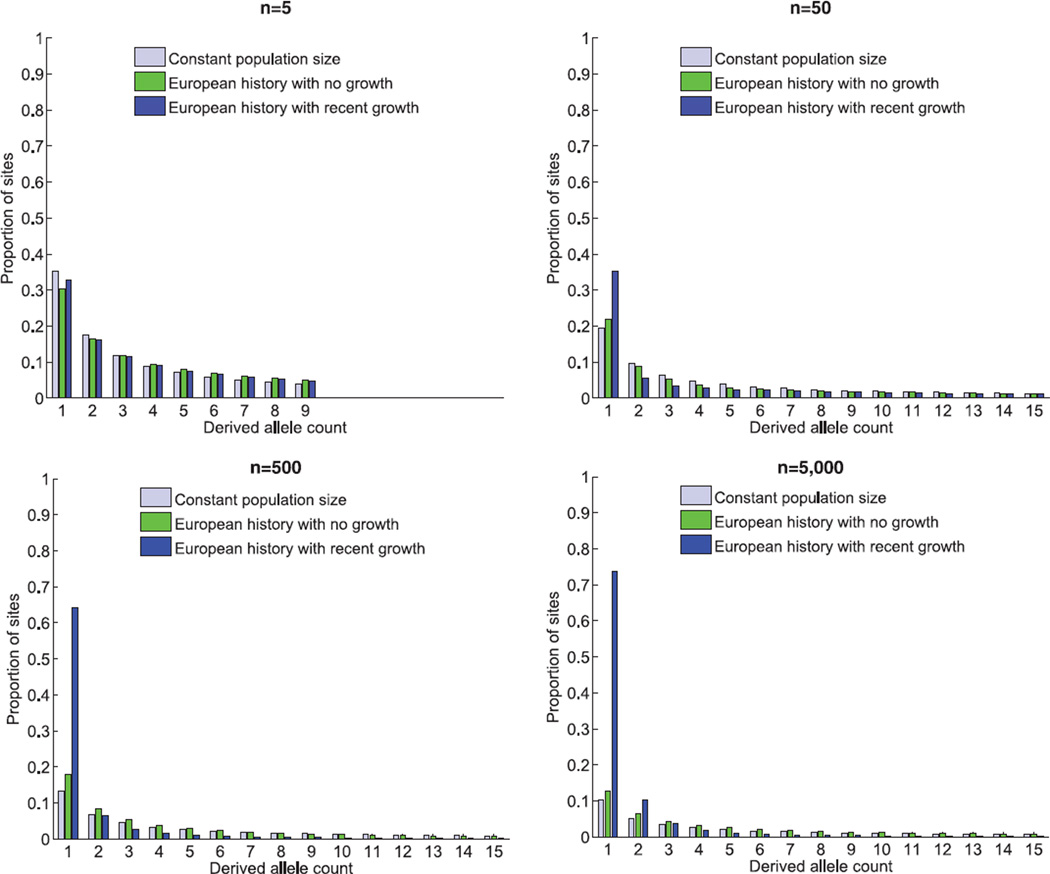
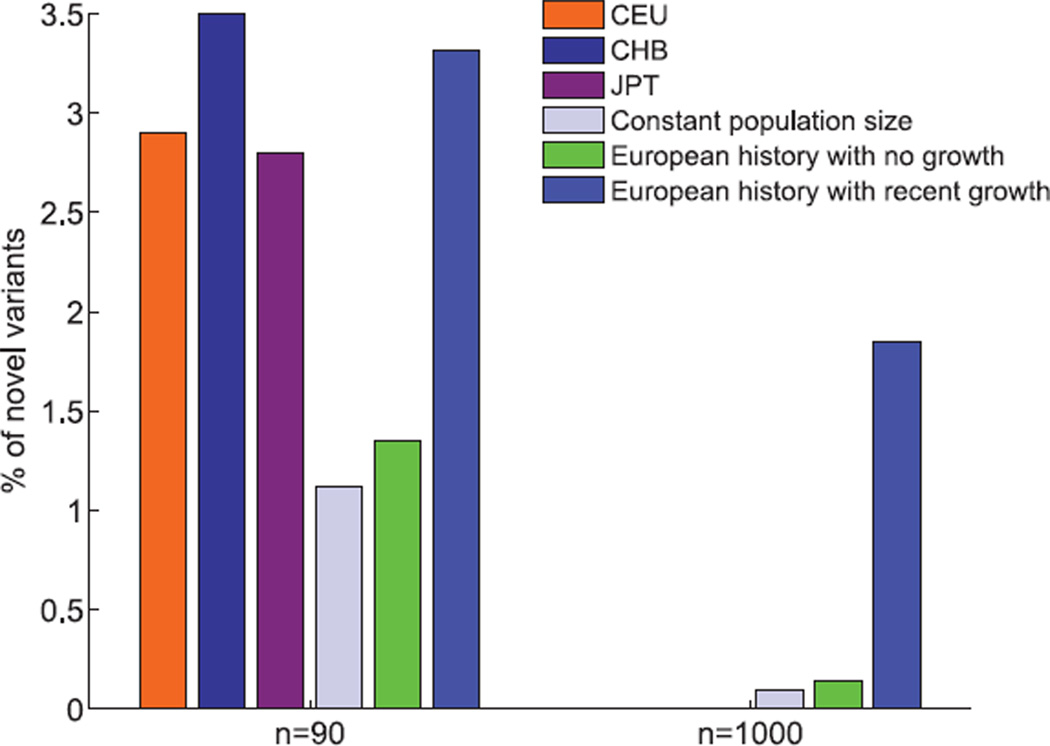
Human populations have experienced recent explosive growth, expanding by at least three orders of magnitude over the past 400 generations. This departure from equilibrium skews patterns of genetic variation and distorts basic principles of population genetics. We characterized the empirical signatures of explosive growth on the site frequency spectrum and found that the discrepancy in rare variant abundance across demographic modeling studies is mostly due to differences in sample size. Rapid recent growth increases the load of rare variants and is likely to play a role in the individual genetic burden of complex disease risk. Hence, the extreme recent human population growth needs to be taken into consideration in studying the genetics of complex diseases and traits.


Figures

Fig. 1
Fig. 1
Census (rather than effective) population size is presented on a logarithm scale over the past 10,000 years, from about 5 million at 8000 BCE to about 7 billion today from data in (1, 3, 30, 31). The depicted linear increase (on the log scale) through most of the presented epoch denotes exponential growth of relatively constant percentage increase in population size per year. An acceleration of that increase starting in the Common Era is evident.
Fig. 2
Fig. 2
The expected site frequency spectrum (SFS) of the derived allele (the new mutation arisen in the population) for three different demographic models: (i) a population that has been of constant size throughout history; (ii) a model previously fit to the derived allele frequency spectrum of Europeans, which includes an out-of-Africa population bottleneck and a second, more recent, population bottleneck (21); and (iii) the same two-bottleneck model of European history with the addition of recent exponential growth from a population size of 10,000 at the advent of agriculture to an extant effective population size of 10,000,000, which amounts to 1.7% growth per generation during the last 400 generations. The results presented are based on sequences of 5, 50, 500, and 5000 diploid individuals. Figures are from 10 million coalescent simulations (32); the expectation of models 1 and 2 were also validated analytically (21). In all panels, the proportions of all possible derived allele counts, ranging from 1 to 2n − 1, sum up to 1, although only those for 1 through 15 are presented. See fig. S1 for a version of this figure in which singletons are excluded and the SFS renormalized.
Fig. 3
Fig. 3
Percentage of novel variants in a sequenced individual. Bars denote the fraction, out of all sites for which a given individual is heterozygous, that are also monomorphic in a separate sample of 90 (left) or 1000 (right) individuals from the same population. Expected fraction is presented for the same three demographic models as in Fig. 2. For n = 90—a value chosen on the basis of availability of empirical data—the observed fraction for three populations of European (CEU), Chinese (CHB), and Japanese (JPT) ancestry is also provided, from resequencing data of ENCODE regions from the HapMap 3 Project (22). We averaged over all possible choices of an individual out of each sample in these data. The empirical results are inconsistent with the two models excluding growth, and they match a simplistic model that includes recent exponential expansion. We note that the empirical estimates are likely slight underestimates due to stringent quality control filters (22). No empirical data are available for a sample of size 1000.

References

    1. Cohen JE. How Many People Can the Earth Support? ed. 1. New York: Norton; 1995.
    1. Roberts L. Science. 2011;333:540. - PubMed
    1. United Nations Department of Economic and Social Affairs Population Division. 2011 - PubMed
    1. Hartl D, Clark A. Principles of Population Genetics. Sunderland, MA: Sinauer; 2007.
    1. Gravel S, et al. 1000 Genomes Project. Proc. Natl. Acad. Sci. U.S.A. 2011;108:11983. - PubMed

Publication types