. 2012 May 7;136(17):174117.
doi: 10.1063/1.4706899.

Two-dimensional stimulated resonance Raman spectroscopy of molecules with broadband x-ray pulses

Affiliations

Two-dimensional stimulated resonance Raman spectroscopy of molecules with broadband x-ray pulses

Jason D Biggs et al. J Chem Phys. .

Abstract

Expressions for the two-dimensional stimulated x-ray Raman spectroscopy (2D-SXRS) signal obtained using attosecond x-ray pulses are derived. The 1D- and 2D-SXRS signals are calculated for trans-N-methyl acetamide (NMA) with broad bandwidth (181 as, 14.2 eV FWHM) pulses tuned to the oxygen and nitrogen K-edges. Crosspeaks in 2D signals reveal electronic Franck-Condon overlaps between valence orbitals and relaxed orbitals in the presence of the core-hole.


Figures

Figure 1
Figure 1
Loop diagrams, pulse sequence, and core and valence energy levels for the 1D-SXRS signal.
Figure 2
Figure 2
Loop diagrams, pulse sequence, and energy levels for the 2D-SXRS signal.
Figure 3
Figure 3
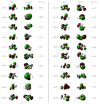
Natural transition orbitals of the dominant excitations in Figs. 111213.
Figure 4
Figure 4
Calculated UV-absorption spectrum of NMA.
Figure 5
Figure 5
Simulated XANES from trans-NMA at the nitrogen (top) and oxygen (bottom) K-edge. The stick spectra (black lines) have been convoluted with a lineshape function (see text) to give the spectra in red. Shown in blue are the power spectra for the Gaussian pulses used in the time-domain experiments described here.
Figure 6
Figure 6
Calculated RIXS signal at the nitrogen K-edge from trans-NMA.
Figure 7
Figure 7
Calculated RIXS signal from trans-NMA at the oxygen K-edge.
Figure 8
Figure 8
Hermitian and anti-Hermitian parts of the effective isotropic polarizabilities (Eq. 7) for the two pulses used in our simulations corresponding to the nitrogen and oxygen K-edge excitations, plotted using an arcsinh nonlinear scale (shown on the right). The Hermitian part is purely real, while the anti-Hermitian part is purely imaginary. The axes are labeled by the state numbers, 0 for the ground state, 1 for S1, etc. State assignments can be found in Table 1.
Figure 9
Figure 9
Calculated SXRS spectra from trans-NMA, in which both pulses are polarized parallel to the lab frame V axis. The pulses are Gaussian, 181 as FWHM in intensity, with center frequency set to either 401.7 eV (N) or 532.0 (O). From left to right we show the real part, imaginary part, and modulus of Eq. 21. The two-color signals (bottom two rows) have their pulse sequences given from left to right in chronological order, i.e., the ON signal results from having the O pulse come first and the N pulse come second.
Figure 10
Figure 10
Simulated 2D-XRS spectrum from trans-NMA using an NNO pulse configuration, plotted as the modulus of the Fourier transform and separated into the contributions from the two types of diagrams in Fig. 2. The labels refer to the pulse center frequency and polarization of the three pulses ordered chronologically from left to right. In the NNO signal, the first and second pulses have their center frequency resonant with the nitrogen K-edge transition, and the third pulse is likewise tuned to the oxygen K-edge. Signals are plotted using an arcsinh nonlinear scale (see color bar) to highlight weak features.
Figure 11
Figure 11
Simulated 2D-XRS spectra from trans-NMA, plotted as the modulus of the Fourier transform. The labels refer to the pulse center frequency and polarization of the three pulses ordered chronologically from left to right. In the NNO signal, the first and second pulses have their center frequency resonant with the nitrogen K-edge transition, and the third pulse is likewise tuned to the oxygen K-edge. Signals are plotted using an arcsinh nonlinear scale to highlight weak features. Traces of each signal along the diagonal are shown in red on top of each signal.
Figure 12
Figure 12
Same as Fig. 11 for the other pulse configurations.
Figure 13
Figure 13
(Left) An enlarged version of the OOO spectrum from Fig. 11, plotted using a nonlinear scale shown on the color bar to the left. (Right) Horizontal and diagonal slices, plotted using a linear scale, of the 2D spectrum on the left (in red) plotted together with the corresponding traces from the corresponding OON (dashed, blue) to highlight the effect of changing the probe pulse in the three-pulse sequence.

References

    1. Marangos J., “Introduction to the new science with x-ray free electron lasers,” Contemp. Phys. 52, 551 (2011).10.1080/00107514.2011.607290 - DOI
    1. Popmintchev T., Chen M., Arpin P., Murnane M. M., and Kapteyn H. C., “The attosecond nonlinear optics of bright coherent x-ray generation,” Nat. Photonics 4, 822 (2010).10.1038/nphoton.2010.256 - DOI
    1. Adams B., Nonlinear Optics, Quantum Optics, and Ultrafast Phenomena with X-Rays (Springer, 2003).
    1. Tanaka S. and Mukamel S., “Probing exciton dynamics using Raman resonances in femtosecond x-ray four-wave mixing,” Phys. Rev. A 67, 033818 (2003).10.1103/PhysRevA.67.033818 - DOI
    1. Mukamel S., Principles of Nonlinear Optical Spectroscopy (Oxford University Press, New York, 1995).

Publication types