. 2012 May 14:5:232.
doi: 10.1186/1756-0500-5-232.

Mouse strain specific gene expression differences for illumina microarray expression profiling in embryos

Affiliations

Mouse strain specific gene expression differences for illumina microarray expression profiling in embryos

Petra Kraus et al. BMC Res Notes. .

Abstract

Background: In the field of mouse genetics the advent of technologies like microarray based expression profiling dramatically increased data availability and sensitivity, yet these advanced methods are often vulnerable to the unavoidable heterogeneity of in vivo material and might therefore reflect differentially expressed genes between mouse strains of no relevance to a targeted experiment. The aim of this study was not to elaborate on the usefulness of microarray analysis in general, but to expand our knowledge regarding this potential "background noise" for the widely used Illumina microarray platform surpassing existing data which focused primarily on the adult sensory and nervous system, by analyzing patterns of gene expression at different embryonic stages using wild type strains and modern transgenic models of often non-isogenic backgrounds.

Results: Wild type embryos of 11 mouse strains commonly used in transgenic and molecular genetic studies at three developmental time points were subjected to Illumina microarray expression profiling in a strain-by-strain comparison. Our data robustly reflects known gene expression patterns during mid-gestation development. Decreasing diversity of the input tissue and/or increasing strain diversity raised the sensitivity of the array towards the genetic background. Consistent strain sensitivity of some probes was attributed to genetic polymorphisms or probe design related artifacts.

Conclusion: Our study provides an extensive reference list of gene expression profiling background noise of value to anyone in the field of developmental biology and transgenic research performing microarray expression profiling with the widely used Illumina microarray platform. Probes identified as strain specific background noise further allow for microarray expression profiling on its own to be a valuable tool for establishing genealogies of mouse inbred strains.


Figures

Figure 1
Figure 1
List of selected targets showing a strain-dependent signal in two and more of the data sets analyzed. Analyzed targets are italicized, affected strains follow in parenthesis and are abbreviated as following: 129 (129 S2/SvHsd), FVBN (FVB/NHan TMHsd) and CD1 (Hsd:ICR(CD-1)®)). Strain dependent signals could generally be attributed to polymorphisms with regards to the C57BL6 based Illumina probe as indicated: single nucleotide exchange (pink), insertion (blue) and deletion (green).
Figure 2
Figure 2
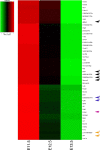
Selected heat map profiles at E11.5, E12.5 and E13.5 of targets with known and unknown roles during mid-gestation development based on differential gene expression analysis of entire wild type embryos averaged across four strains (C57BL/6J, 129 S2/SvHsd, FVB/NHan TMHsd and Hsd:ICR(CD-1)®) at any given developmental stage. Similarities in the heat map profile can lead to the identification of new targets of interest (black arrows a to d, blue arrows, orange arrows), suggest relevant stages to investigate further (purple arrow, black arrow “b”) or possible splice variants (black arrows “c” and “d”).
Figure 3
Figure 3
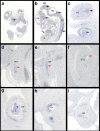
Prl3b1 expression at E11.5 visualized by RNA-ISH on sagittal sections of Hsd:ICR(CD1)® wild type embryos. Parasagittal (a) lateral and (b) medial section through the embryo at 32x showing expression in forebrain (FB), midbrain (MB), hindbrain (HB) and neural tube (NT) (black arrows), the lens (blue arrow) and retina (green arrow) (c) Parasagittal lateral section through forebrain and eye at 100x showing expression in the forebrain (FB, black arrow), lens (blue arrow) and retina (green arrow). (d/e/f) sections through stomach (STO) and gut (INT) at 200x with expression in the epithelial layers (red arrow). (g/h) Parasagittal sections through the eye (neural layer (green arrow) and pigment layer (orange arrow) of the retina (RE), lens (L, blue arrow) and otic vesicle (OV) respectively at 200x and (i) through the nasal region at 100× showing expression in the nasal epithelium (NE).
Figure 4
Figure 4
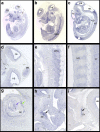
Ninl expression at E11.5 visualized by RNA-ISH on parasagittal sections of Hsd:ICR(CD1)® wild type embryos. (a/b/c) Sections through the embryo from parasagittal lateral to medial at 32× showing expression in the forebrain (FB), midbrain (MB) and hindbrain (HB), the neural tube (NT), the sensory organs, the dorsal root ganglia (DRG) and the intervertebral discs (IVD). (d) Section through the head at 50× showing expression in forebrain (FB), midbrain (MB) and hindbrain (HB). (e) latero-medial section through dorsal root ganglia at 100×. (f) Medial section through the vertebral column at 200× showing expression in the intervertebral disc (IVD) and neural tube (NT). (g) Section through the eye at 200× showing expression in the lens (L, blue arrow) and retina (RE, green arrow). (h/i) sections through the nasal epithelia (NE) and otic vesicle (OV), respectively, at 100× (black arrows).
Figure 5
Figure 5
Panther gene ontology (GO) term analysis for the three data sets (A) (entire embryos of four strains (C57BL/6J, 129 S2/SvHsd, FVB/NHan TMHsd and Hsd:ICR(CD-1)® at E12.5), (B) (eviscerated embryos of four strains (C57BL/6J, 129 S2/SvHsd, FVB/NHan TMHsd and Hsd:ICR(CD-1)® at E12.5) and (C) (eviscerated embryos of 11 strains (129 S2/SvHsd; FVB/NHan TMHsd; C3H/HeNHs; CBA/JHsd; BALB/cOlaHsd; C.B-17/IcrHanTMHsd-Prkdcscid; C57BL/6J; B6; SJL-Tg(Col2a1-cre)1Bhr/J; 129 S4/SvJaeSor-Gt(Rosa)26Sortm1(FLP1)Dym/J; C57BL/6-Tg(Zp3-cre)93Knw/J; Hsd:ICR(CD-1)®) at E12.5 analyzed in pie view (left) and bar view (middle) alongside the color legend (right) identifying the related GO terms and numbers according to Panther.
Figure 6
Figure 6
Mouse strain gene ontology relationships for 11 strains based on microarray based differential gene expression analysis of eviscerated embryos at E12.5. For simplicity the strain names have been abbreviated in this tree view figure. The full strain name is given in brackets preceded by the abbreviation as following: 129 [129 S2/SvHsd]; FVBN [FVB/NHan TMHsd]; C3H [C3H/HeNHs]; CBA [CBA/JHsd]; BalbC [BALB/cOlaHsd]; SCID [C.B-17/IcrHanTMHsd-Prkdcscid]; B6 [C57BL/6J]; Col2aCre [B6; SJL-Tg(Col2a1-cre)1Bhr/J]; ROSAFlpe [129 S4/SvJaeSor-Gt(Rosa)26Sortm1(FLP1)Dym/J]; ZP3Cre [C57BL/6-Tg(Zp3-cre)93Knw/J] and CD1 [Hsd:ICR(CD-1)®)]. The numbers 1 to 4 for each group refer to the biological replicate.

References

    1. Green EL. Biology of the laboratory mouse. New York: Dover Publication; 1966.
    1. Niswander L. Interplay between the molecular signals that control vertebrate limb development. Int J Dev Biol. 2002;46:877–881. - PubMed
    1. Zervas M, Blaess S, Joyner AL. Classical embryological studies and modern genetic analysis of midbrain and cerebellum development. Curr Top Dev Biol. 2005;69:101–138. - PubMed
    1. Roberts DJ. Molecular mechanisms of development of the gastrointestinal tract. Dev Dyn. 2000;219:109–120. doi: 10.1002/1097-0177(2000)9999:9999<::AID-DVDY1047>3.3.CO;2-Y. - DOI - PubMed
    1. Vokes SA, Ji H, Wong WH, McMahon AP. A genome-scale analysis of the cis-regulatory circuitry underlying sonic hedgehog-mediated patterning of the mammalian limb. Genes Dev. 2008;22:2651–2663. doi: 10.1101/gad.1693008. - DOI - PMC - PubMed

Publication types

LinkOut - more resources