. 2012 May 14:13:185.
doi: 10.1186/1471-2164-13-185.

Development and application of a 6.5 million feature Affymetrix Genechip® for massively parallel discovery of single position polymorphisms in lettuce (Lactuca spp.)

Affiliations

Development and application of a 6.5 million feature Affymetrix Genechip® for massively parallel discovery of single position polymorphisms in lettuce (Lactuca spp.)

Kevin Stoffel et al. BMC Genomics. .

Abstract

Background: High-resolution genetic maps are needed in many crops to help characterize the genetic diversity that determines agriculturally important traits. Hybridization to microarrays to detect single feature polymorphisms is a powerful technique for marker discovery and genotyping because of its highly parallel nature. However, microarrays designed for gene expression analysis rarely provide sufficient gene coverage for optimal detection of nucleotide polymorphisms, which limits utility in species with low rates of polymorphism such as lettuce (Lactuca sativa).

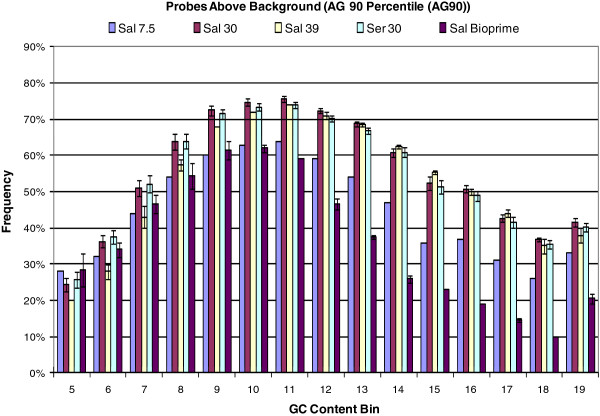
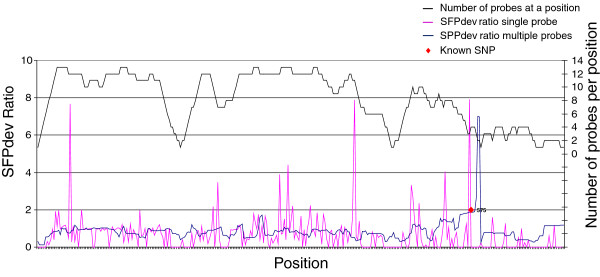
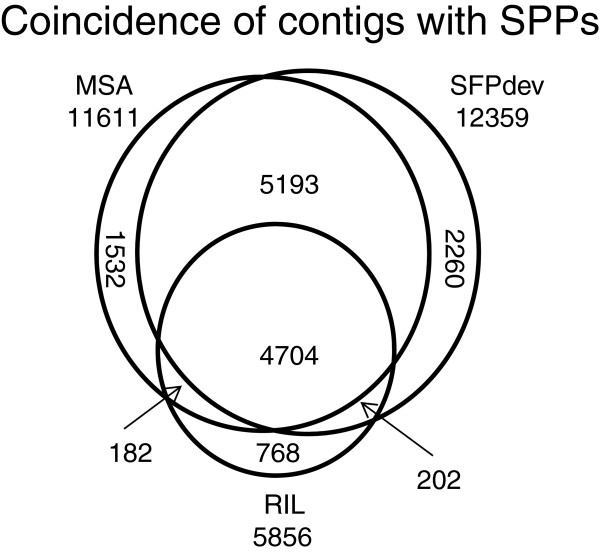
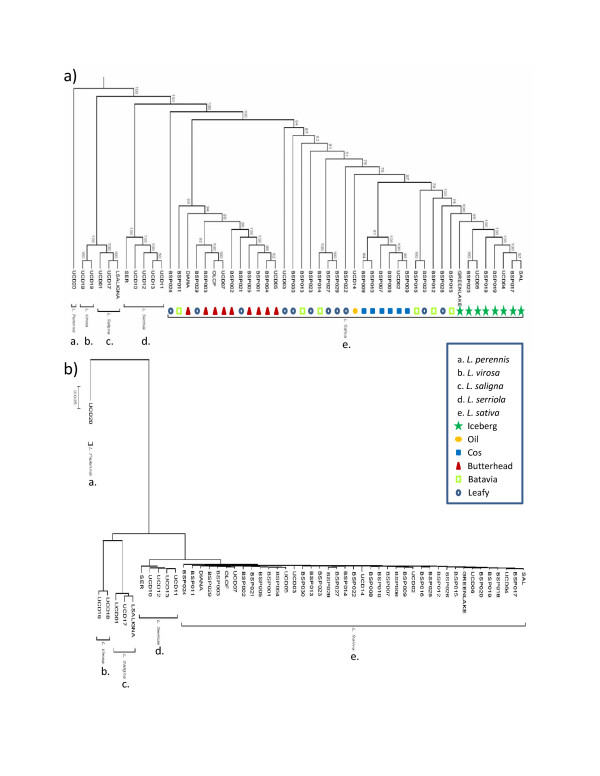
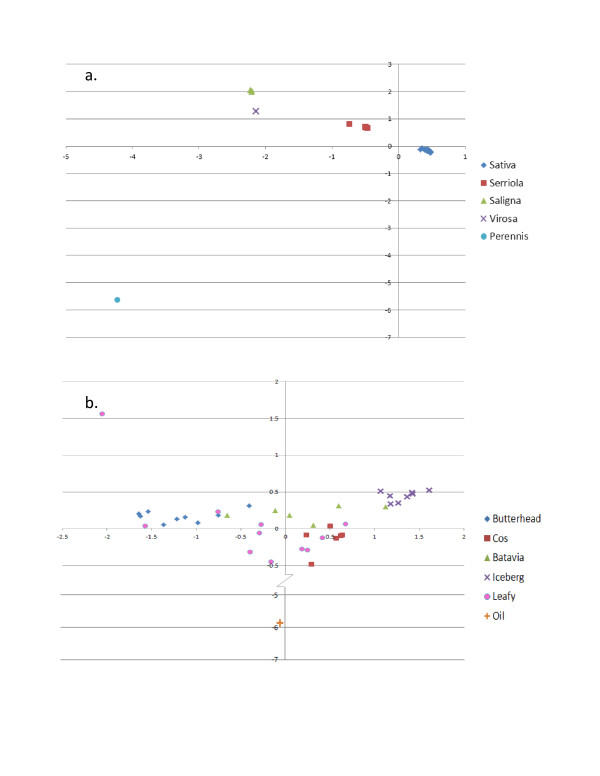
Results: We developed a 6.5 million feature Affymetrix GeneChip® for efficient polymorphism discovery and genotyping, as well as for analysis of gene expression in lettuce. Probes on the microarray were designed from 26,809 unigenes from cultivated lettuce and an additional 8,819 unigenes from four related species (L. serriola, L. saligna, L. virosa and L. perennis). Where possible, probes were tiled with a 2 bp stagger, alternating on each DNA strand; providing an average of 187 probes covering approximately 600 bp for each of over 35,000 unigenes; resulting in up to 13 fold redundancy in coverage per nucleotide. We developed protocols for hybridization of genomic DNA to the GeneChip® and refined custom algorithms that utilized coverage from multiple, high quality probes to detect single position polymorphisms in 2 bp sliding windows across each unigene. This allowed us to detect greater than 18,000 polymorphisms between the parental lines of our core mapping population, as well as numerous polymorphisms between cultivated lettuce and wild species in the lettuce genepool. Using marker data from our diversity panel comprised of 52 accessions from the five species listed above, we were able to separate accessions by species using both phylogenetic and principal component analyses. Additionally, we estimated the diversity between different types of cultivated lettuce and distinguished morphological types.

Conclusion: By hybridizing genomic DNA to a custom oligonucleotide array designed for maximum gene coverage, we were able to identify polymorphisms using two approaches for pair-wise comparisons, as well as a highly parallel method that compared all 52 genotypes simultaneously.


Figures

Figure 1
Figure 1
Pair-wise scatter plots of 600,000 probes from SAL and SER. Pair-wise scatter plots of RMA background corrected hybridization values for 600,000 random probes for two technical replicates of L. sativa cv. Salinas (SAL_TG_01, SAL_TG_02) and L. serriola acc. US96UC23 (SER_TG_01, SER_TG_02). Comparisons across species show larger deviations than those between replicates
Figure 2
Figure 2
Frequency of probes with hybridization signals greater than background per GC bin. Frequency (y-axis) of lettuce probes on the GeneChip®, per GC content bin (x-axis), with a hybridization signal that is higher than the 90 percentile of the hybridization signal of the anti-genomic probes with corresponding GC content. Results are shown for L. sativa cv. Salinas hybridizations with 7.5, 30 or 39 μg of gDNA, L. serriola with 30 ug gDNA, L. sativa cv. Salinas hybridizations with Genomic DNA fragmented and labeled using BioPrime (Invitrogen, Carlsbad, CA, USA), and L. serriola acc. UC96US23 hybridizations with 30 μg of gDNA
Figure 3
Figure 3
Agarose gel electrophoresis of genomic DNA extracted from lettuce. Two μls from a 30 μg fragmentation of lettuce genomic DNA with DNase I was separated on 2% agarose gel and visualized by ethidium bromide staining. Lengths in bp the O’GeneRuler™ 50 bp DNA ladder (Fermentas, Glen Burnie, MD, USA) are shown. Samples were accepted for labeling provided that the majority of fragments were within 50 to 250 bp
Figure 4
Figure 4
Graphical representation of SFP vs. SPP calls along a contig. The x-axis shows the position of a probe along a contig. The y-axis shows the difference in the average weighted SFPdev or SPPdev values between the two genotypes. The SPP analysis detected only the true SNPs while the SFP analysis indicated multiple false positives
Figure 5
Figure 5
A graphical representation of the equation used to determine a weighting factor at each position. The graph shows the mean hybridization difference between L. sativa cv. Salinas and L. serriola acc. US96UC23 (y-axis) plotted against the 2 bp interrogation position relative to the central position of the probe being measured (x-axis). The equation above was used for calculating the weighting factor used in the two-genotype comparison algorithms
Figure 6
Figure 6
Venn diagram showing the overlap of contigs containing SPPs among the three SPP identification methods. A Venn diagram of the three SPP identification methods shows the overlap of contigs containing SPPs between each method. The two pair-wise comparison methods had the largest overlap of identified contigs. MSA – pairwise comparison using a modified version of the algorithm described by Borevitz et al.[1]. SFPdev – pairwise comparison using a modified version of the algorithm described by West et al.[5]. RIL - massively parallel approach looking at the distribution of SPP calls for all individuals in a diversity panel
Figure 7
Figure 7
Phylogenetic trees estimating the relationship of all individuals in the diversity panel. a) Dendogram estimating the relationship of genotypes in the diversity panel. Bootstrap values indicate the confidence in branch positioning. b) Representative phylogram showing the relative relatedness of individuals. Each species is monophyletic
Figure 8
Figure 8
Two dimensional scatter graphs of eigenvalues from principal component analysis. The first two significant eigenvalues from principal component analyses performed with SAS software PRINCOMP procedure are plotted against each other to show resolution within species or classes. a) Eigenvalues significant at P < 0.0001 from principal components one and two are plotted against each other and show clear resolution of species. b) Eigenvalues one and three were both significant at P < 0.0001 and were plotted against each other. The y-axis was altered to show clearer resolution in non-oil genotypes. Batavia and Leafy classes show distribution through the scatter plot similar to that seen in Figure 7a and 7b

Comment in

References

    1. Borevitz JO, Liang D, Plouffe D, Chang HS, Zhu T, Weigel D, Berry CC, Winzeler E, Chory J. Large-scale identification of single-feature polymorphisms in complex genomes. Genome Res. 2003;13:513–523. doi: 10.1101/gr.541303. - DOI - PMC - PubMed
    1. Das S, Bhat PR, Sudhakar C, Ehlers JD, Wanamaker S, Roberts PA, Cui X, Close TJ. Detection and validation of single feature polymorphisms in cowpea (vigna unguiculata l. Walp) using a soybean genome array. BMC Genomics. 2008;9:107. doi: 10.1186/1471-2164-9-107. - DOI - PMC - PubMed
    1. Kumar R, Qiu J, Joshi T, Valliyodan B, Xu D, Nguyen HT. Single feature polymorphism discovery in rice. PLoS One. 2007;2:e284. doi: 10.1371/journal.pone.0000284. - DOI - PMC - PubMed
    1. Rostoks N, Borevitz JO, Hedley PE, Russell J, Mudie S, Morris J, Cardle L, Marshall DF, Waugh R. Single-feature polymorphism discovery in the barley transcriptome. Genome Biol. 2005;6:R54. doi: 10.1186/gb-2005-6-6-r54. - DOI - PMC - PubMed
    1. West MA, van Leeuwen H, Kozik A, Kliebenstein DJ, Doerge RW, Clair DA St, Michelmore RW. High-density haplotyping with microarray-based expression and single feature polymorphism markers in arabidopsis. Genome Res. 2006;16:787–795. doi: 10.1101/gr.5011206. - DOI - PMC - PubMed

Publication types