. 2012 May 14:13:186.
doi: 10.1186/1471-2164-13-186.

Estimating RNA-quality using GeneChip microarrays

Affiliations

Estimating RNA-quality using GeneChip microarrays

Mario Fasold et al. BMC Genomics. .

Abstract

Background: Microarrays are a powerful tool for transcriptome analysis. Best results are obtained using high-quality RNA samples for preparation and hybridization. Issues with RNA integrity can lead to low data quality and failure of the microarray experiment.

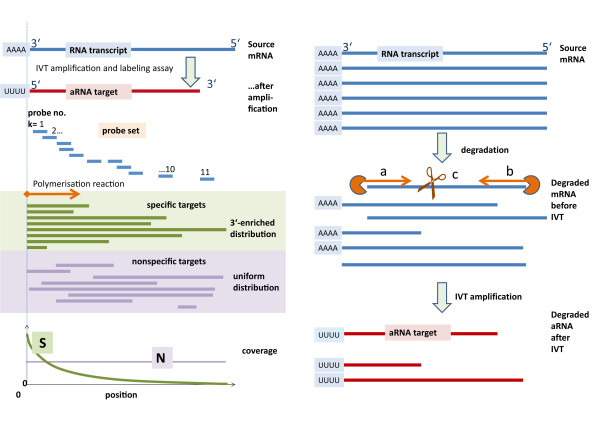
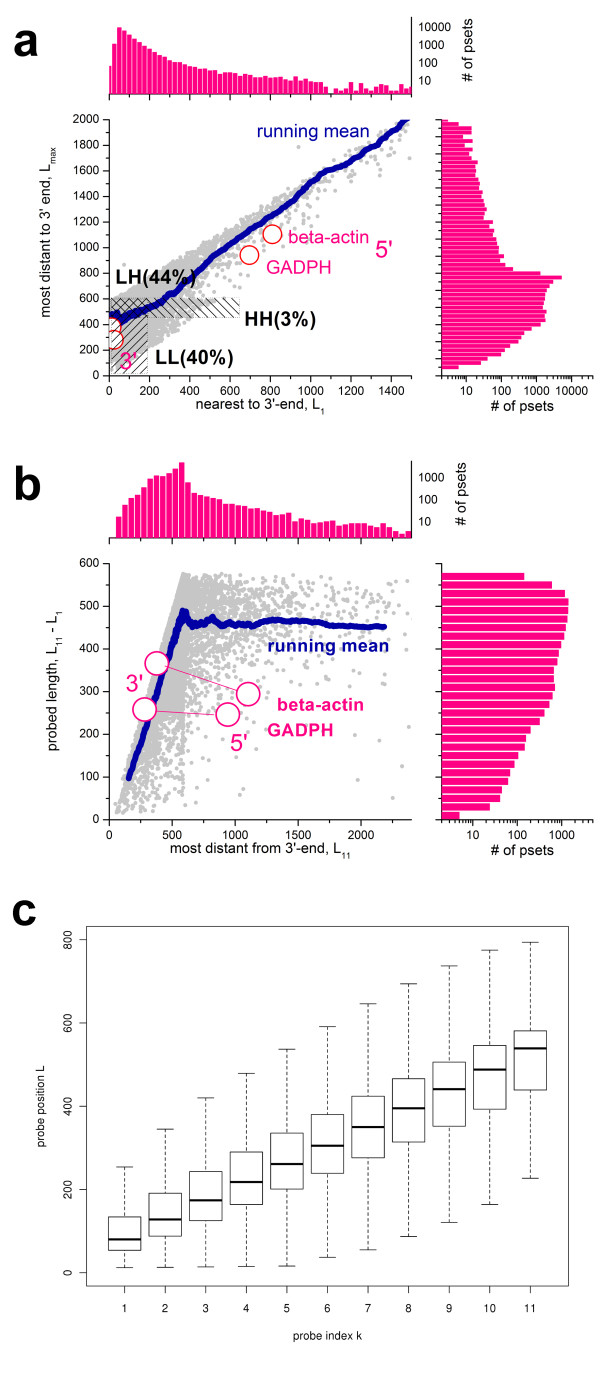
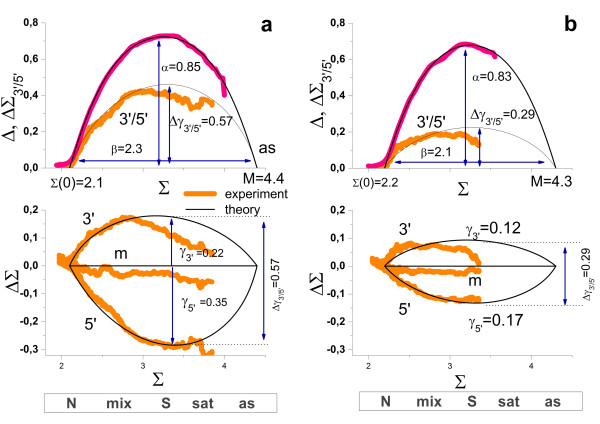
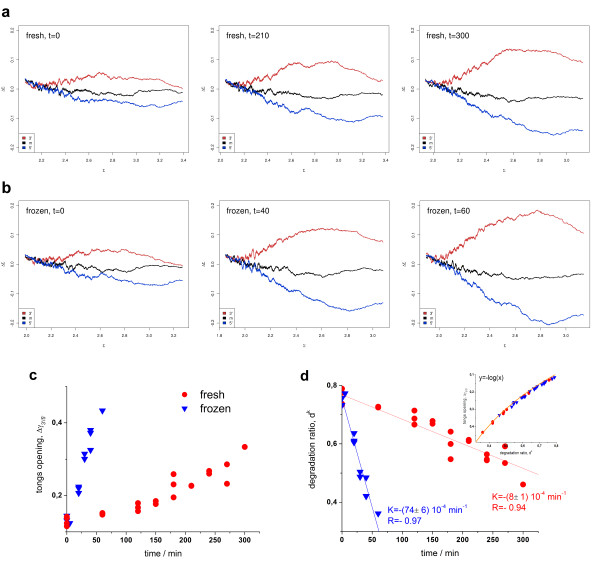
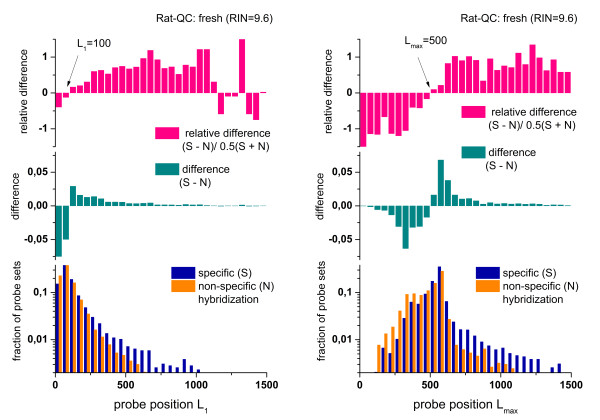
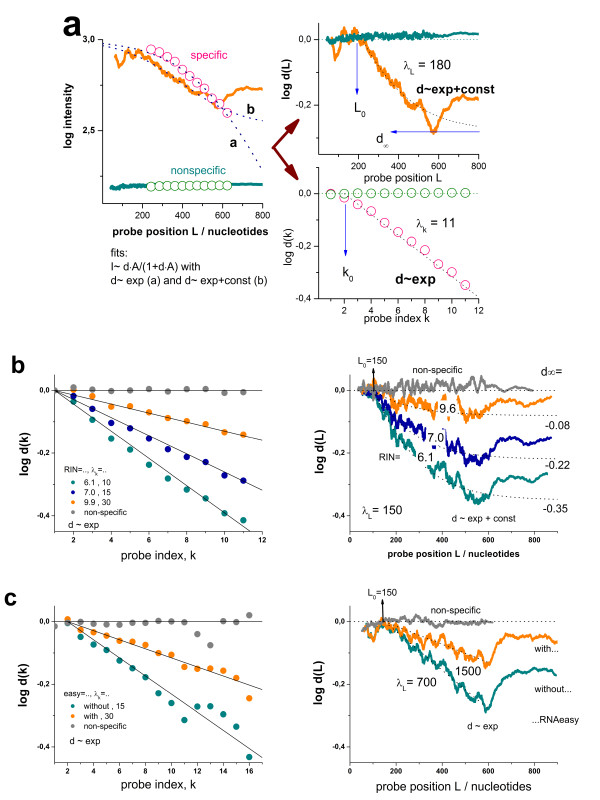
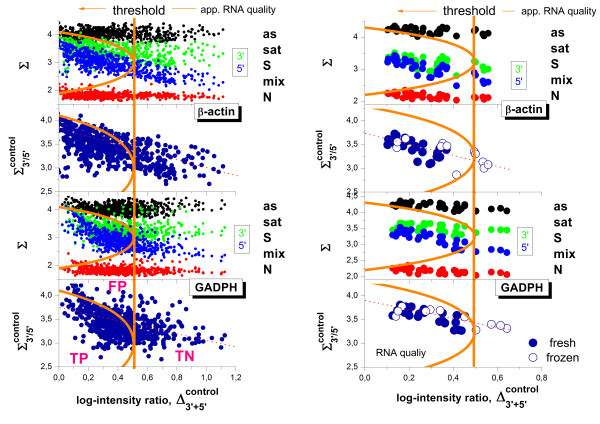
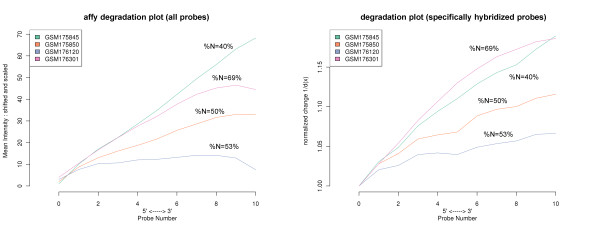
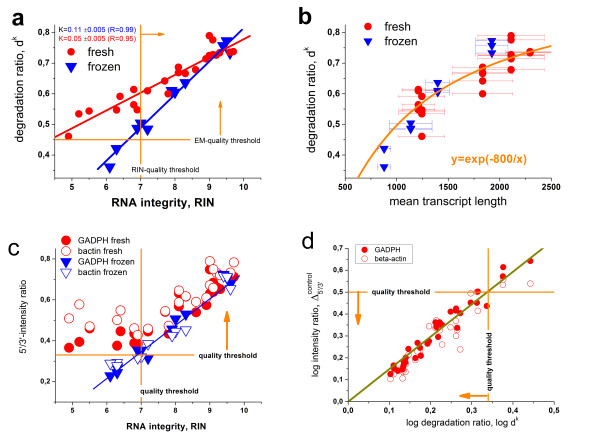
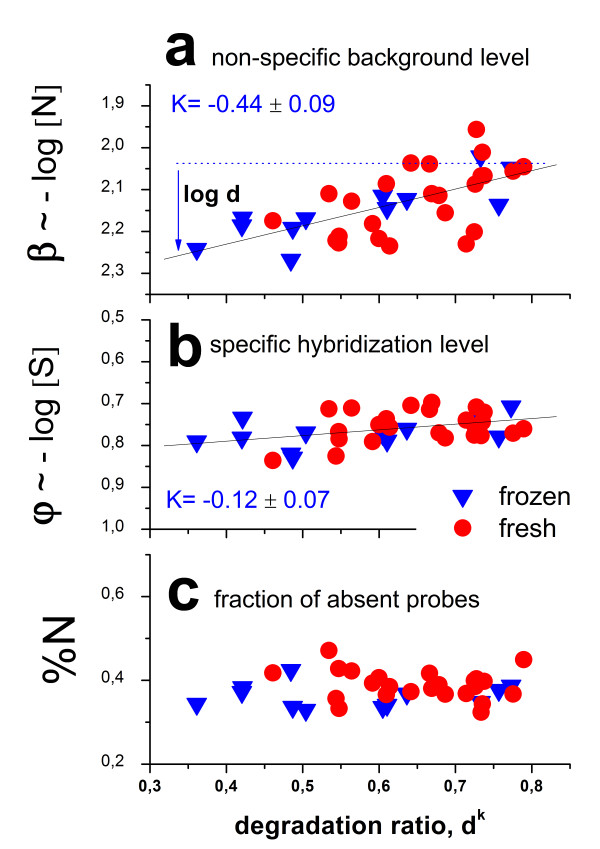
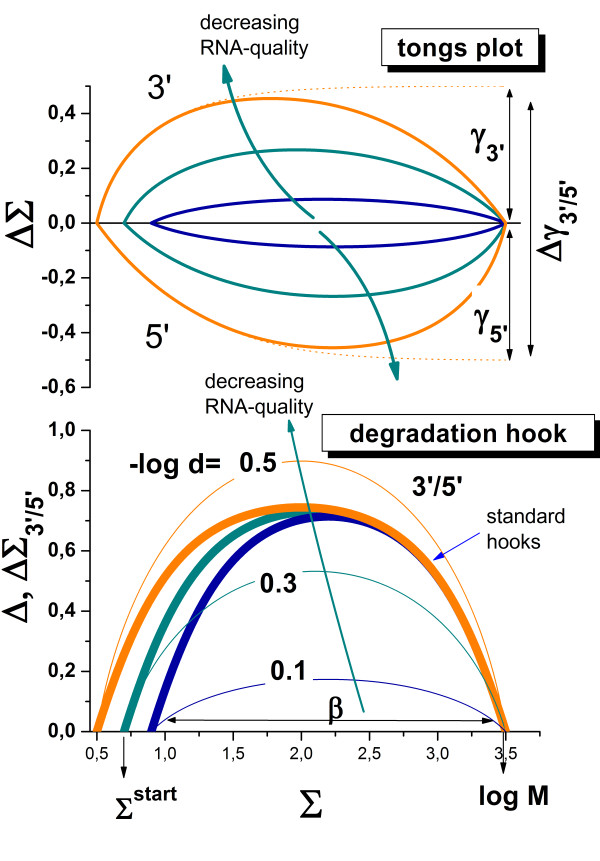
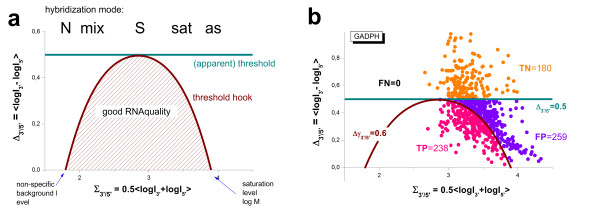
Results: Microarray intensity data contains information to estimate the RNA quality of the sample. We here study the interplay of the characteristics of RNA surface hybridization with the effects of partly truncated transcripts on probe intensity. The 3'/5' intensity gradient, the basis of microarray RNA quality measures, is shown to depend on the degree of competitive binding of specific and of non-specific targets to a particular probe, on the degree of saturation of the probes with bound transcripts and on the distance of the probe from the 3'-end of the transcript. Increasing degrees of non-specific hybridization or of saturation reduce the 3'/5' intensity gradient and if not taken into account, this leads to biased results in common quality measures for GeneChip arrays such as affyslope or the control probe intensity ratio. We also found that short probe sets near the 3'-end of the transcripts are prone to non-specific hybridization presumable because of inaccurate positional assignment and the existence of transcript isoforms with variable 3' UTRs. Poor RNA quality is associated with a decreased amount of RNA material hybridized on the array paralleled by a decreased total signal level. Additionally, it causes a gene-specific loss of signal due to the positional bias of transcript abundance which requires an individual, gene-specific correction. We propose a new RNA quality measure that considers the hybridization mode. Graphical characteristics are introduced allowing assessment of RNA quality of each single array ('tongs plot' and 'degradation hook'). Furthermore, we suggest a method to correct for effects of RNA degradation on microarray intensities.

Conclusions: The presented RNA degradation measure has best correlation with the independent RNA integrity measure RIN, and therefore presents itself as a valuable tool for quality control and even for the study of RNA degradation. When RNA degradation effects are detected in microarray experiments, a correction of the induced bias in probe intensities is advised.


Figures

Figure 1
Figure 1
The 3′-bias of transcript abundance can be caused by in vitro transcription (left part) and degradation (right part) of source mRNA. Left part: Specific targets hybridize to the probes along the interrogated transcript with decreasing frequency due to incomplete amplification starting at the primers attached to the 3′-poly-A motif of source mRNA. In contrast, cross-hybridization of non-specific targets is not associated with the 3′-end of the transcripts giving rise to uniform coverage. Right part: Degradation of source mRNA due to RNases from both ends (a and b) and/or fragmentation at randomly chosen positions (c) also result in a 3′-enriched length distribution of amplified RNA giving rise to a similar coverage of the probes as shown in the left part. aRNA fragments are shown in 3′ → 5′ direction (from left to right) in contrast to convention to agree with the probe numbering used (k = 1, 2…) and the intensity decays introduced below
Figure 2
Figure 2
Probe and probe set characteristics of the RAE230 GeneChip array: Panel a correlates the position of the 11th (nearest the 5′ end of the transcripts) and of the 1th (nearest the 3′ end) probe of each probe set and shows the respective number distributions. Most probe sets accumulate in the LH (low L1, high L11) and LL ranges whereas only a few sets are found in the HH range. Panel b shows the coverage size of the probe sets (ΔL = L11- L1) as a function of the position of the 11th probe set together with the respective number distributions. The mean ΔL value nearly linearly increases until k11 ≈ 600 and then it remains virtually constant with ΔL ≈ 460. The most probe sets cover a transcript range of 400 – 550 nucleotides. The open circles refer to the 3′- and 5′-control probe sets. The boxplot in part c correlates the probe index k with the probe position L. The median position per index (see the horizontal bar in each box) nearly linearly increases with k. The slope provides the < ΔL > −value of the array which characterizes the probe sensitivity per index increment (~ 50 nucleotide positions per index increment)
Figure 3
Figure 3
Hook- and degradation hook (above) and tongs-plot (below) of two selected chip hybridization taken form the human body index data set (muscle, GEO accession numbers GSM176301 in part a and skin, GSM175967 in part b) referring to large and smaller degradation effects, respectively. Note that all plots use the same abscissa scaling (Σ, see Eq. (7)) which is related to the expression degree of the respective probes. The hook curve reveals the changing hybridization mode with increasing sigma: non-specific (N), mixed N and S (mix), specific (S), saturation (sat) and asymptotic (as) ranges. The degradation hook and the tongs-plot reveal the mean 3′/5′-intensity bias of the probes. The three branches of the tongs plot refer to three probes nearest to the 3′-end (upper branch), nearest to the 5′-end (lower branch) and located in the middle in-between (middle branch). Note that the different branches split maximally in the S-range of hybridization whereas no bias is observed in the N-range as predicted by theory (lines, see Eqs. (16) and (21) for the hook and tongs plot, respectively). The theoretical curves are calculated using the formulae given in the methodical section using the parameters given in the figure. The hook dimensions (α, ‘height’ of the hook, see Eq. (18); β, ‘width’ of the hook; Σ(0), ‘start’ point; M, ‘end’-point) are very similar for both arrays whereas the logarithmic 3′- and 5′-degradation levels (Eq. (24)) are markedly different. The size of the moving window is decreased towards the right end of the tongs plot to compensate the reduced number of probe sets in saturation range. As a consequence, the part of the curves beyond of the maximum is prone to increasing error
Figure 4
Figure 4
Collection of tongs plots taken from the ratQC data set. The RNA was extracted from liver samples either after ex vivo incubation of fresh tissue (panel a, incubation time 0, 210 and 300 min) or after thawing frozen tissue (b, incubation time 0, 40 and 60 min). The plots in panel c and d show the tongs-opening and the dk parameter of both series as a function of the incubation time, respectively. RNA prepared from frozen samples degrades much faster than RNA from fresh samples. The insert in part b correlates the dk and tongs opening parameters. Their relation follows a logarithmic function
Figure 5
Figure 5
Distribution of probe sets hybridized predominantly with specific and non-specific transcripts as a function of the position of the first (left part) and last (right part) probe of each probe set. The graphs show that ‘short’ probe sets located nearer to the 3′-end of the transcript are more prone to bind non-specific transcripts at (L1 < 100 and Lmax < 500) than specific ones. The part in the middle shows the difference between the respective fractions of probe sets whereas the part above normalizes this difference with respect to the mean fraction of probe sets in both, S- and N-groups. Accordingly, the differential binding refers to about 50% of all probe sets. The distributions are calculated using the ratQC data set
Figure 6
Figure 6
Positional dependent intensity decays in relative and absolute scale. Panel a) Mean intensity decays of specifically and non-specifically hybridized probes (Eq. (8)) referring to the data shown in Figure 3a. The circles denote index-based averages which are plotted as a function of the mean position per index (left part). The decays are normalized according to Eq. (9) (right part of the figure). The dotted curves in part a are theoretical ones using different functions: Exponential plus constant (a) and exponential (b) intensity decays which consider saturation without initial shift (Eq. (10) with x0=0); exponential plus constant (right part above) and exponential (right part below) decays with initial shifts (Eq. (10) with x0=0). Panel b and c) Representative decays are taken from the Rat-QC (b) and the RNeasy cleanup (c) data sets. The index-scaled decays in the left part and the L-scaled decay in the right part of panel c are fit using simple exponential decays (d = 0) whereas the L-scaled decays in part b in addition use a constant d > 0
Figure 7
Figure 7
Hybridization and RNA-quality characteristics of the GADPH and beta-actin control probe sets in the tissue (left) and rat-QC (right) data sets. Each data point refers to one array of the respective series. The abscissa provides the degradation level in units of the logged 3′/5′- mean intensity ratio of the respective control data sets. The vertical axes plot either sigma coordinates of the 3′- (green dots) and 5′- (blue dots) probe sets of the controls, or their mean (dark blue circles). The red and black dots mark the respective sigma-levels of non-specific binding and of saturation, respectively. The vertical orange lines indicate the constant quality threshold separating good (to the left) and poor (to the right) apparent RNA quality. The ‘threshold’ hooks (orange) refer to the same quality threshold. They however explicitly consider its decrease in the N- and sat-ranges of hybridization. Application of the constant threshold thus produces false positives together with true positives and true negatives (see also Figure 12)
Figure 8
Figure 8
RNA degradation plot of all probes (panel a) and degradation profile of specifically hybridized probes (b) for microarrays selected from the human tissue data set. Panel a shows the plots obtained using the affy package [16] whereas the curves in panel b are given by the inverse of the degradation function dS(k)-1 (see Eq. (10)). The slopes of most of the curves rank in the same order in both panels, except the two curves of steepest slope which reverse order in both parts of the figure owing to the different percentage of absent probes. The percentage of absent probes are %N = 40% (GSM175845), 69% (GSM176301), 50% (GSM175850) and 53% (GSM176120) as determined by the hook method [33,34]
Figure 9
Figure 9
Comparison of microarray degradation measures (dk and 5′/3′-ratio of the hybridization controls) with the RNA integrity number (RIN, panel a and c) and with the mean length of the transcripts (panel b) obtained in the ratQC experiment. [10] The dk parameter split into two branches for the two sample treatments when plotted as a function of RIN whereas the dk data virtually merge into one branch if plotted as a function of transcript length. Panel d correlates the dk and the 5′/3′- intensity ratio of the control probes in logarithmic scale. The vertical and horizontal orange lines indicate the respective quality thresholds. Good RNA-quality probes are found in direction of the arrows
Figure 10
Figure 10
Hook-hybridization characteristics of the arrays of the ratQC data set. (a) The width of the hook curves β increases with progressive degradation indicating the decrease of the non-specific background due to the loss of material (see Eq. (18)). Log d is the mean degradation index (Eq. (2)) and K the slope of the regression line. The mean level of specific hybridization changes only weakly with degradation (b). The fraction of absent probes is virtually unaffected by degradation (c). All parameters are estimated using the hook method [33,34]
Figure 11
Figure 11
Theoretical hook curve (Eq. (16), thick curves), degradation hook (thin curves) and tongs plot (panel above; Eqs. (20) and (21)) for different degradation levels log d. With increasing degradation the positive and negative amplitudes of the tongs plot (the tongs opening Δγ3′/5′) and the height of the degradation hook increase, accompanied by the shift of its increasing branch towards the left which widens the curves (parameter β). The curves are calculated with γ3′ = −γ5′ = 0.1, 0.3 and 0.5, respectively. The dotted curves in the part above are calculated neglecting the saturation term in Eq. (21). The geometrical meaning of selected parameters is indicated by arrows (see text)
Figure 12
Figure 12
Threshold hook for estimating good RNA quality using control probe sets. (a) Constant (apparent) and variable (threshold hook) RNA quality threshold. The true threshold depends on the hybridization regime and vanished upon non-specific hybridization and upon saturation. (b) Error estimates of GADPH-controls taken from the tissue data set (see text)

Similar articles

Cited by

References

    1. Lee J, Hever A, Willhite D, Zlotnik A, Hevezi P. Effects of RNA degradation on gene expression analysis of human postmortem tissues. FASEB J. 2005;04:3552fje. - PubMed
    1. Copois V, Bibeau F, Bascoul-Mollevi C, Salvetat N, Chalbos P, Bareil C, Candeil L, Fraslon C, Conseiller E, Granci V, Mazière P, Kramar A, Ychou M, Pau B, Martineau P, Molina F, Rio MD. Impact of RNA degradation on gene expression profiles: Assessment of different methods to reliably determine RNA quality. J Biotechnol. 2007;127:549–559. doi: 10.1016/j.jbiotec.2006.07.032. - DOI - PubMed
    1. Dumur CI, Nasim S, Best AM, Archer KJ, Ladd AC, Mas VR, Wilkinson DS, Garrett CT, Ferreira-Gonzalez A. Evaluation of quality-control criteria for microarray gene expression analysis. Clin Chem. 2004;50(11):1994–2002. doi: 10.1373/clinchem.2004.033225. - DOI - PubMed
    1. Popova T, Mennerich D, Weith A, Quast K. Effect of RNA quality on transcript intensity levels in microarray analysis of human post-mortem brain tissues. BMC Genomics. 2008;9:91. doi: 10.1186/1471-2164-9-91. - DOI - PMC - PubMed
    1. Fleige S, Pfaffl MW. RNA integrity and the effect on the real-time qRT-PCR performance. Molecular Aspects of Medicine. 2006;27:126–139. doi: 10.1016/j.mam.2005.12.003. - DOI - PubMed

Publication types

LinkOut - more resources