

Genome-scale modeling using flux ratio constraints to enable metabolic engineering of clostridial metabolism in silico
- PMID: 22583864
- PMCID: PMC3495714
- DOI: 10.1186/1752-0509-6-42
Genome-scale modeling using flux ratio constraints to enable metabolic engineering of clostridial metabolism in silico
Abstract
Background: Genome-scale metabolic networks and flux models are an effective platform for linking an organism genotype to its phenotype. However, few modeling approaches offer predictive capabilities to evaluate potential metabolic engineering strategies in silico.
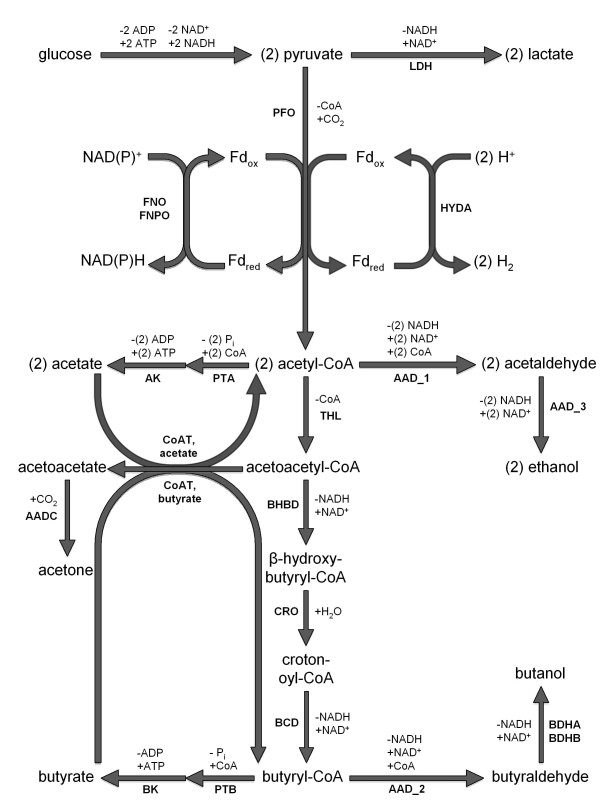
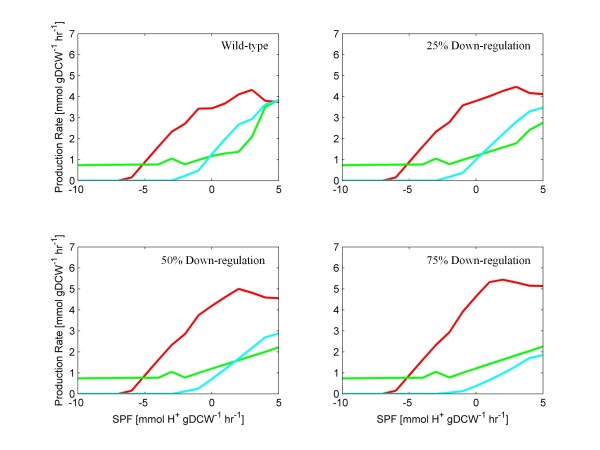
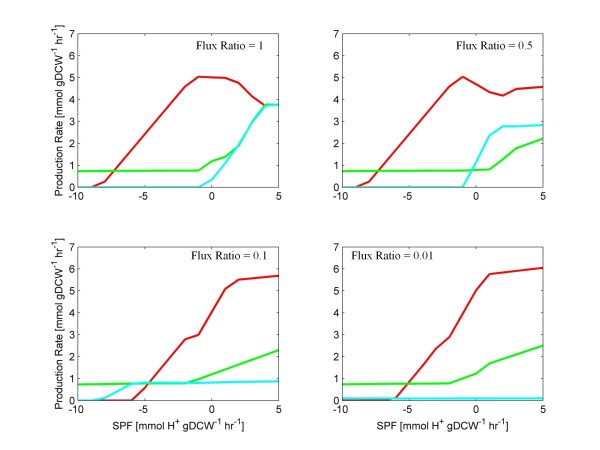
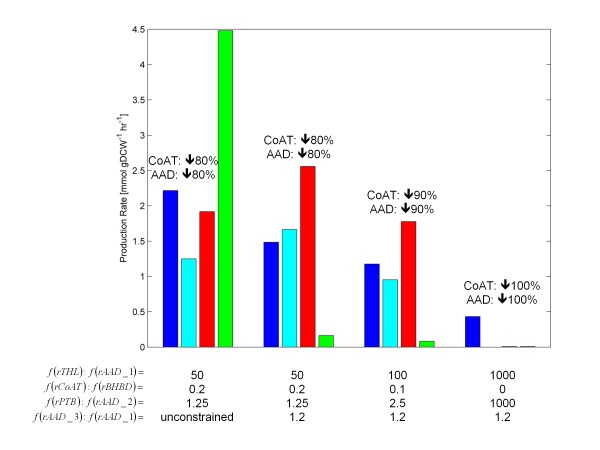
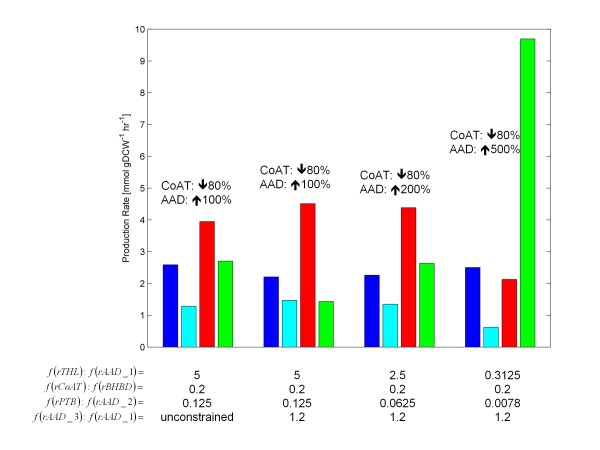
Results: A new method called "flux balance analysis with flux ratios (FBrAtio)" was developed in this research and applied to a new genome-scale model of Clostridium acetobutylicum ATCC 824 (iCAC490) that contains 707 metabolites and 794 reactions. FBrAtio was used to model wild-type metabolism and metabolically engineered strains of C. acetobutylicum where only flux ratio constraints and thermodynamic reversibility of reactions were required. The FBrAtio approach allowed solutions to be found through standard linear programming. Five flux ratio constraints were required to achieve a qualitative picture of wild-type metabolism for C. acetobutylicum for the production of: (i) acetate, (ii) lactate, (iii) butyrate, (iv) acetone, (v) butanol, (vi) ethanol, (vii) CO2 and (viii) H2. Results of this simulation study coincide with published experimental results and show the knockdown of the acetoacetyl-CoA transferase increases butanol to acetone selectivity, while the simultaneous over-expression of the aldehyde/alcohol dehydrogenase greatly increases ethanol production.
Conclusions: FBrAtio is a promising new method for constraining genome-scale models using internal flux ratios. The method was effective for modeling wild-type and engineered strains of C. acetobutylicum.
Figures
Similar articles
-
Aldehyde-alcohol dehydrogenase and/or thiolase overexpression coupled with CoA transferase downregulation lead to higher alcohol titers and selectivity in Clostridium acetobutylicum fermentations.Biotechnol Bioeng. 2009 Jan 1;102(1):38-49. doi: 10.1002/bit.22058. Biotechnol Bioeng. 2009. PMID: 18726959
-
Deriving metabolic engineering strategies from genome-scale modeling with flux ratio constraints.Biotechnol J. 2013 May;8(5):581-94. doi: 10.1002/biot.201200234. Epub 2013 Apr 11. Biotechnol J. 2013. PMID: 23460591
-
Metabolic engineering of Clostridium acetobutylicum M5 for highly selective butanol production.Biotechnol J. 2009 Oct;4(10):1432-40. doi: 10.1002/biot.200900142. Biotechnol J. 2009. PMID: 19830716
-
Application of new metabolic engineering tools for Clostridium acetobutylicum.Appl Microbiol Biotechnol. 2014 Jul;98(13):5823-37. doi: 10.1007/s00253-014-5785-5. Epub 2014 May 10. Appl Microbiol Biotechnol. 2014. PMID: 24816621 Review.
-
Recent advances in n-butanol and butyrate production using engineered Clostridium tyrobutyricum.World J Microbiol Biotechnol. 2020 Aug 14;36(9):138. doi: 10.1007/s11274-020-02914-2. World J Microbiol Biotechnol. 2020. PMID: 32794091 Review.
Cited by
-
CiliateGEM: an open-project and a tool for predictions of ciliate metabolic variations and experimental condition design.BMC Bioinformatics. 2018 Nov 30;19(Suppl 15):442. doi: 10.1186/s12859-018-2422-9. BMC Bioinformatics. 2018. PMID: 30497359 Free PMC article.
-
Clostridium butyricum maximizes growth while minimizing enzyme usage and ATP production: metabolic flux distribution of a strain cultured in glycerol.BMC Syst Biol. 2017 Jun 1;11(1):58. doi: 10.1186/s12918-017-0434-0. BMC Syst Biol. 2017. PMID: 28571567 Free PMC article.
-
CONTRABASS: exploiting flux constraints in genome-scale models for the detection of vulnerabilities.Bioinformatics. 2023 Feb 3;39(2):btad053. doi: 10.1093/bioinformatics/btad053. Bioinformatics. 2023. PMID: 36692133 Free PMC article.
-
Metabolic changes in Klebsiella oxytoca in response to low oxidoreduction potential, as revealed by comparative proteomic profiling integrated with flux balance analysis.Appl Environ Microbiol. 2014 May;80(9):2833-41. doi: 10.1128/AEM.03327-13. Epub 2014 Feb 28. Appl Environ Microbiol. 2014. PMID: 24584239 Free PMC article.
-
CBFA: phenotype prediction integrating metabolic models with constraints derived from experimental data.BMC Syst Biol. 2014 Dec 3;8:123. doi: 10.1186/s12918-014-0123-1. BMC Syst Biol. 2014. PMID: 25466481 Free PMC article.
References
-
- Calik P, Ozdamar TH. Bioreaction network flux analysis for industrial microorganisms: A review. Rev Chem Eng. 2002;18:553–596.
Publication types
MeSH terms
Substances
LinkOut - more resources
Full Text Sources
Other Literature Sources
Molecular Biology Databases
