

A framework for identifying distinct multipollutant profiles in air pollution data
- PMID: 22584082
- PMCID: PMC3774277
- DOI: 10.1016/j.envint.2012.04.003
A framework for identifying distinct multipollutant profiles in air pollution data
Abstract
Background: The importance of describing, understanding and regulating multi-pollutant mixtures has been highlighted by the US National Academy of Science and the Environmental Protection Agency. Furthering our understanding of the health effects associated with exposure to mixtures of pollutants will lead to the development of new multi-pollutant National Air Quality Standards.
Objectives: Introduce a framework within which diagnostic methods that are based on our understanding of air pollution mixtures are used to validate the distinct air pollutant mixtures identified using cluster analysis.
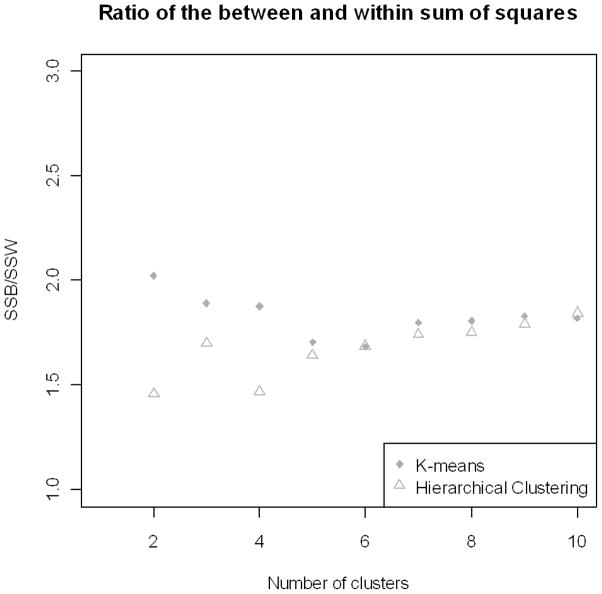
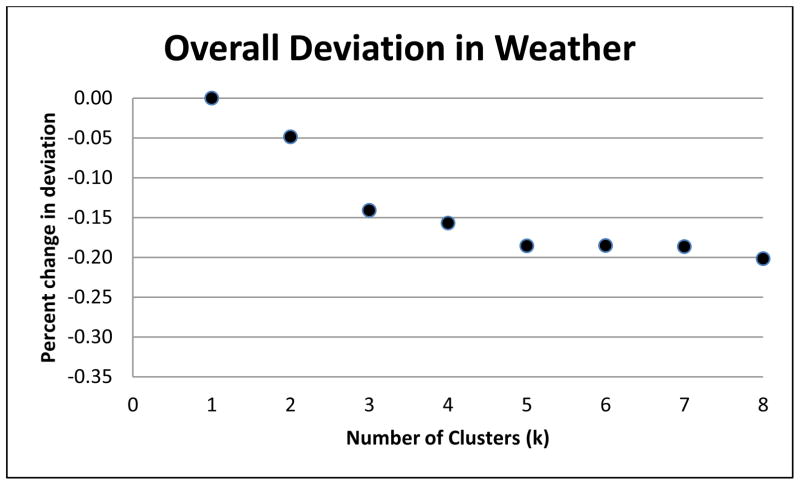
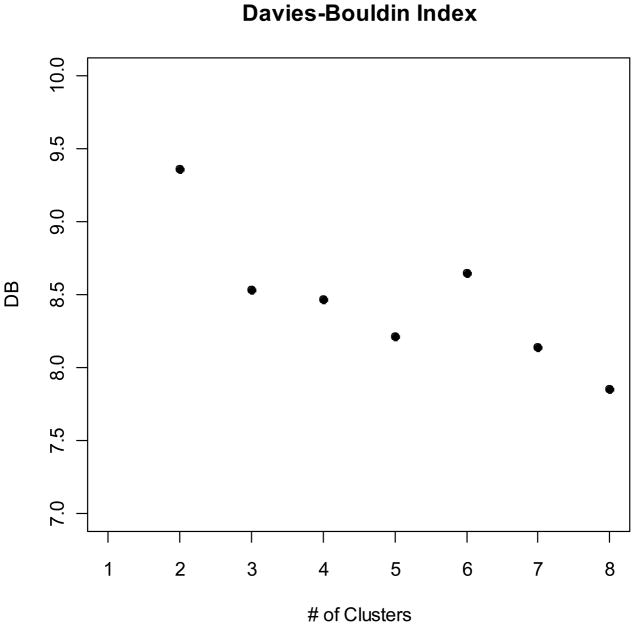
Methods: Six years of daily gaseous and particulate air pollution data collected in Boston, MA were classified solely on their concentration profiles. Classification was performed using k-means partitioning and hierarchical clustering. Diagnostic strategies were developed to identify the most optimal clustering.
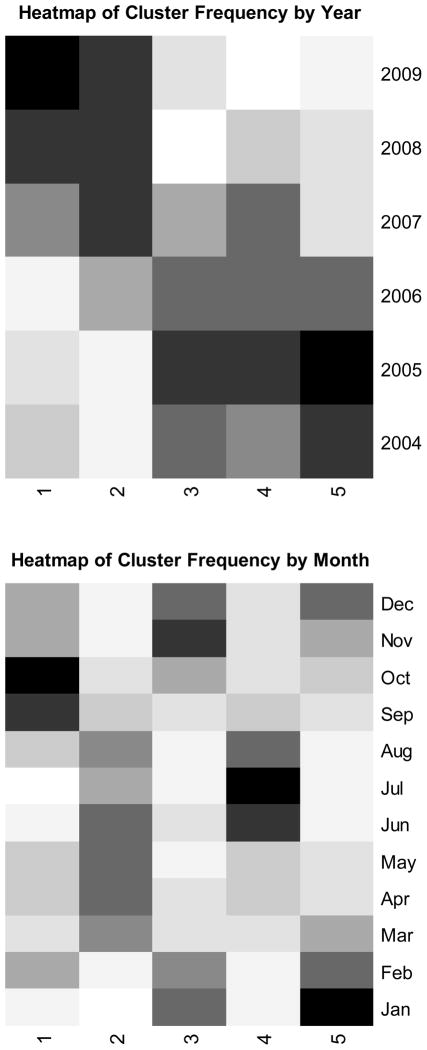
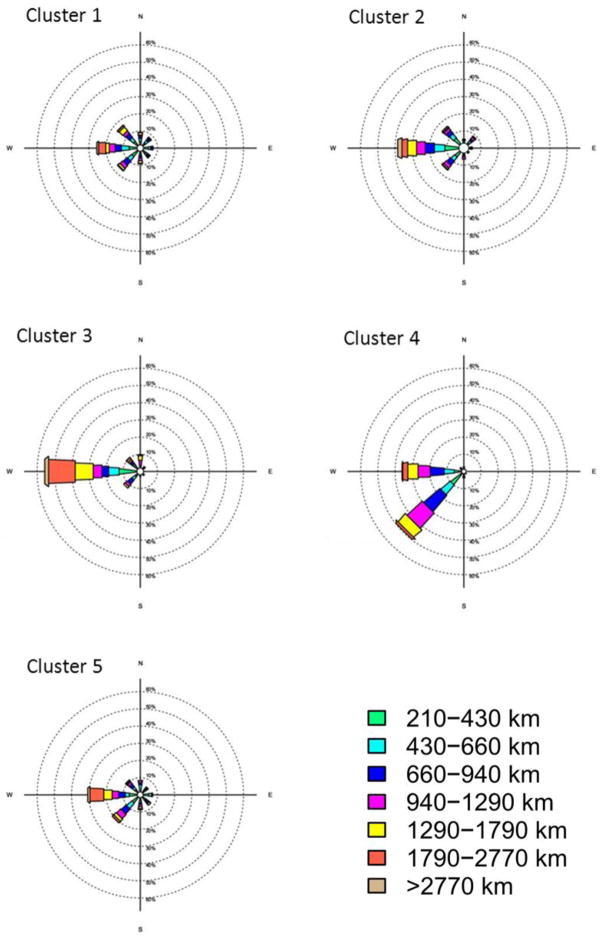
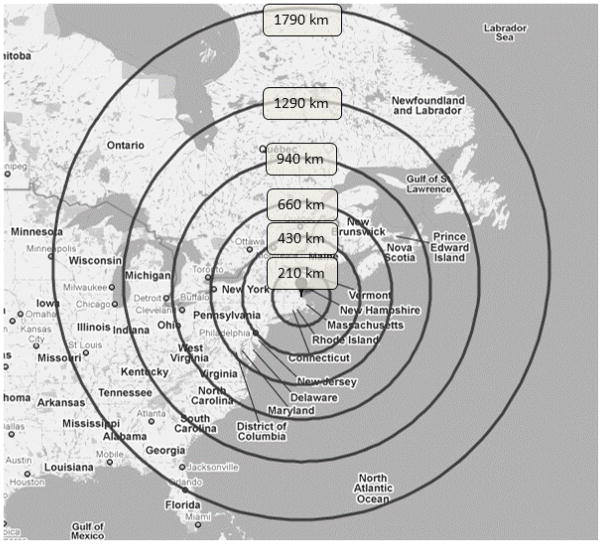
Results: The optimal solution used k-means analysis and contained five distinct groups of days. Pollutant concentrations and elemental ratios were computed in order to characterize the differences between clusters. Time-series regression confirmed that the groups differed in their chemical compositions. The mean values of meteorological parameters were estimated for each group and air mass origin between clusters was examined using back-trajectory analysis. This allowed us to link the distinct physico-chemical characteristics of each cluster to characteristic weather patterns and show that different clusters were associated with distinct air mass origins.
Conclusions: This analysis yielded a solution that was robust to outlier points and interpretable based on chemical, physical and meteorological characteristics. This novel method provides an exciting tool with which to identify and further investigate multi-pollutant mixtures and link them directly to health effects studies.
Copyright © 2012 Elsevier Ltd. All rights reserved.
Conflict of interest statement
The authors declare they have no actual or potential competing financial interests.
Figures
References
-
- Beaver S, Palazoglu A. A cluster aggregation scheme for ozone episode selection in the San Francisco, CA Bay Area. Atmos Environ. 2006;40:713–25.
-
- Blashfield RK. Mixture model tests of cluster analysis: Accuracy of four agglomerative hierarchical methods. Psychol Bull. 1976;83:377.
-
- Cheng YH, Li YS. Influences of Traffic Emissions and Meteorological Conditions on Ambient PM10 and PM2. 5 Levels at a Highway Toll Station. Aerosol Air Qual Res. 2010;10:456–62.
-
- Chung Y, Dann T. Observations of stratospheric ozone at the ground level in Regina, Canada. Atmospheric Environment (1967) 1985;19:157–62.
Publication types
MeSH terms
Substances
Grants and funding
LinkOut - more resources
Full Text Sources
Medical
