Randomized Controlled Trial
. 2012 Jul;35(7):1446-54.
doi: 10.2337/dc11-1928. Epub 2012 May 14.

Sequential intensification of metformin treatment in type 2 diabetes with liraglutide followed by randomized addition of basal insulin prompted by A1C targets

Collaborators, Affiliations
Randomized Controlled Trial

Sequential intensification of metformin treatment in type 2 diabetes with liraglutide followed by randomized addition of basal insulin prompted by A1C targets

J Hans DeVries et al. Diabetes Care. 2012 Jul.

Abstract

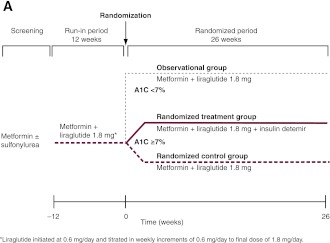
Objective: We evaluated the addition of liraglutide to metformin in type 2 diabetes followed by intensification with basal insulin (detemir) if glycated hemoglobin (A1C) ≥7%.

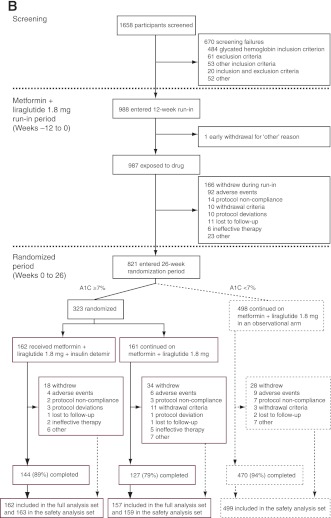
Research design and methods: In 988 participants from North America and Europe uncontrolled on metformin ± sulfonylurea, sulfonylurea was discontinued and liraglutide 1.8 mg/day added for 12 weeks (run-in). Subsequently, those with A1C ≥7% were randomized 1:1 to 26 weeks' open-label addition of insulin detemir to metformin + liraglutide (n = 162) or continuation without insulin detemir (n = 161). Patients achieving A1C <7% continued unchanged treatment (observational arm). The primary end point was A1C change between randomized groups.

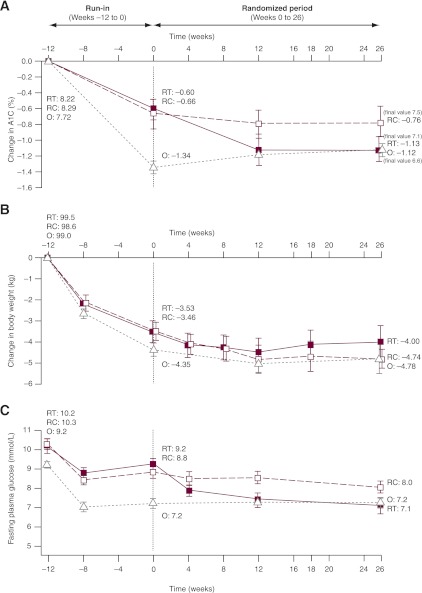
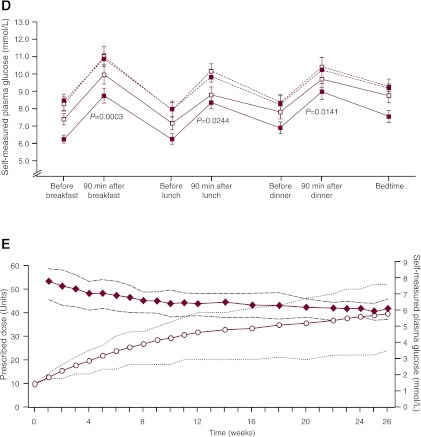
Results: Of 821 participants completing the run-in, 61% (n = 498) achieved A1C <7% (mean change -1.3% from 7.7% at start), whereas 39% (n = 323) did not (-0.6% from 8.3% at start). During run-in, 167 of 988 (17%) withdrew; 46% of these due to gastrointestinal adverse events. At week 26, A1C decreased further, by 0.5% (from 7.6% at randomization) with insulin detemir (n = 162) versus 0.02% increase without insulin detemir (n = 157) to 7.1 and 7.5%, respectively (estimated treatment difference -0.52 [95% CI -0.68 to -0.36]; P < 0.0001). Forty-three percent of participants with insulin detemir versus 17% without reached A1C <7%. Mean weight decreased by 3.5 kg during run-in, then by 0.16 kg with insulin detemir or 0.95 kg without insulin detemir. In the randomized phase, no major hypoglycemia occurred and minor hypoglycemia rates were 0.286 and 0.029 events per participant-year with and without insulin detemir (9.2 vs. 1.3%).

Conclusions: Supplementation of metformin with liraglutide and then insulin detemir was well tolerated in the majority of patients, with good glycemic control, sustained weight loss, and very low hypoglycemia rates.

Trial registration: ClinicalTrials.gov NCT00856986.


Figures

Figure 1
Figure 1
Trial design (A) and trial flow diagram (B). *Two participants who had been randomized to the metformin and liraglutide control group received the wrong trial treatment. One participant was supplied with insulin detemir but withdrew before administering the treatment. The other participant should not have been randomized as her A1C level at week 0 was <7%. For the full analysis, these participants appear in the randomized control group, and for the safety analysis, they appear in their respective “treatment” groups (i.e., insulin detemir and observational groups, respectively).
Figure 1
Figure 1
Trial design (A) and trial flow diagram (B). *Two participants who had been randomized to the metformin and liraglutide control group received the wrong trial treatment. One participant was supplied with insulin detemir but withdrew before administering the treatment. The other participant should not have been randomized as her A1C level at week 0 was <7%. For the full analysis, these participants appear in the randomized control group, and for the safety analysis, they appear in their respective “treatment” groups (i.e., insulin detemir and observational groups, respectively).
Figure 2
Figure 2
Glycemic efficacy, changes in body weight, and insulin detemir doses. Results from run-in to randomization (vertical dotted line) and from randomization to the end of the trial for change in A1C (A), change in body weight (B), and mean FPG (C). Data are means ± 2 SE from the full analysis set with no imputation. RT, randomized treatment group; RC, randomized control group; O, observational group. D: Self-monitored plasma glucose profiles before and after breakfast, lunch, and dinner and at bedtime for the treatment and control groups at weeks 0 and 26. ■, randomized treatment group; □, randomized control group; △, observational group. Dotted lines, 0 weeks; solid lines, 26 weeks. Vertical bars indicate ± 2 SEM. P values refer to differences between groups in the change from randomization (week 0) to week 26. E: Insulin detemir dose (prescribed dose, ○, left ordinate) and self-measured FPG (♦, right ordinate) during the 26-week randomized period for the insulin detemir treatment group. Dotted lines indicate 25th–75th percentiles.
Figure 2
Figure 2
Glycemic efficacy, changes in body weight, and insulin detemir doses. Results from run-in to randomization (vertical dotted line) and from randomization to the end of the trial for change in A1C (A), change in body weight (B), and mean FPG (C). Data are means ± 2 SE from the full analysis set with no imputation. RT, randomized treatment group; RC, randomized control group; O, observational group. D: Self-monitored plasma glucose profiles before and after breakfast, lunch, and dinner and at bedtime for the treatment and control groups at weeks 0 and 26. ■, randomized treatment group; □, randomized control group; △, observational group. Dotted lines, 0 weeks; solid lines, 26 weeks. Vertical bars indicate ± 2 SEM. P values refer to differences between groups in the change from randomization (week 0) to week 26. E: Insulin detemir dose (prescribed dose, ○, left ordinate) and self-measured FPG (♦, right ordinate) during the 26-week randomized period for the insulin detemir treatment group. Dotted lines indicate 25th–75th percentiles.

References

    1. Nathan DM, Buse JB, Davidson MB, et al. American Diabetes Association. European Association for the Study of Diabetes Medical management of hyperglycaemia in type 2 diabetes mellitus: a consensus algorithm for the initiation and adjustment of therapy: a consensus statement from the American Diabetes Association and the European Association for the Study of Diabetes. Diabetologia 2009;52:17–30 - PubMed
    1. American Diabetes Association Standards of medical care in diabetes—2010. Diabetes Care 2010;33(Suppl. 1):S11–S61 - PMC - PubMed
    1. Buse JB, Rosenstock J, Sesti G, et al. LEAD-6 Study Group Liraglutide once a day versus exenatide twice a day for type 2 diabetes: a 26-week randomised, parallel-group, multinational, open-label trial (LEAD-6). Lancet 2009;374:39–47 - PubMed
    1. Nauck MA, Frid A, Hermansen K, et al. LEAD-2 Study Group Efficacy and safety comparison of liraglutide, glimepiride, and placebo, all in combination with metformin, in type 2 diabetes: the LEAD (liraglutide effect and action in diabetes)-2 study. Diabetes Care 2009;32:84–90 - PMC - PubMed
    1. Russell-Jones D, Vaag A, Schmitz O, et al. ; Liraglutide Effect and Action in Diabetes 5 (LEAD-5) met+SU Study Group. Liraglutide vs insulin glargine and placebo in combination with metformin and sulfonylurea therapy in type 2 diabetes mellitus (LEAD-5 met+SU): a randomized controlled trial. Diabetologia 2009;52:2046–2055 - PMC - PubMed

Publication types

MeSH terms

Associated data

LinkOut - more resources