. 2012 Sep;40(16):e126.
doi: 10.1093/nar/gks406. Epub 2012 May 14.

PhiSpy: a novel algorithm for finding prophages in bacterial genomes that combines similarity- and composition-based strategies

Affiliations

PhiSpy: a novel algorithm for finding prophages in bacterial genomes that combines similarity- and composition-based strategies

Sajia Akhter et al. Nucleic Acids Res. 2012 Sep.

Abstract

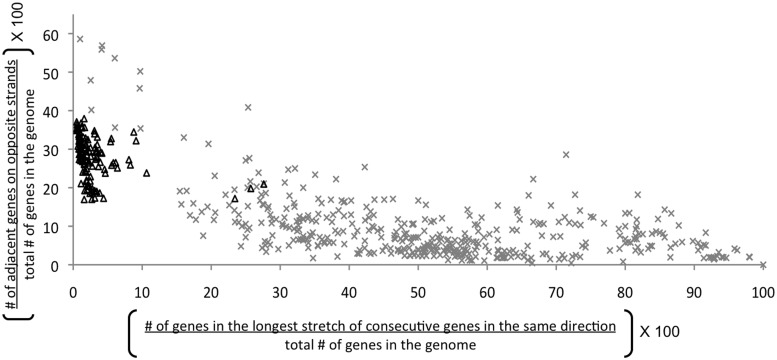
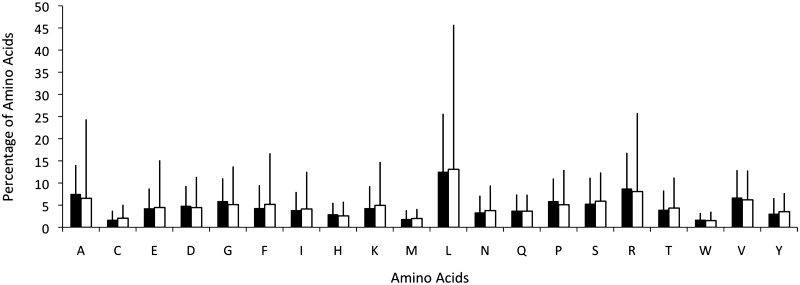
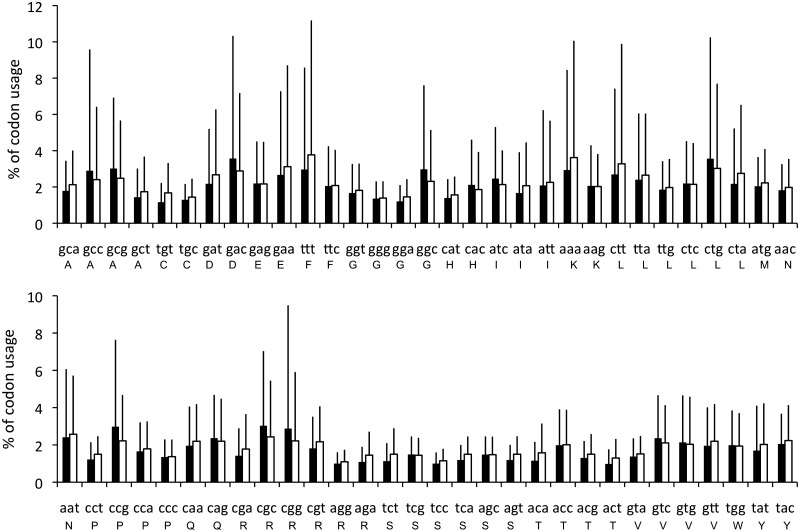
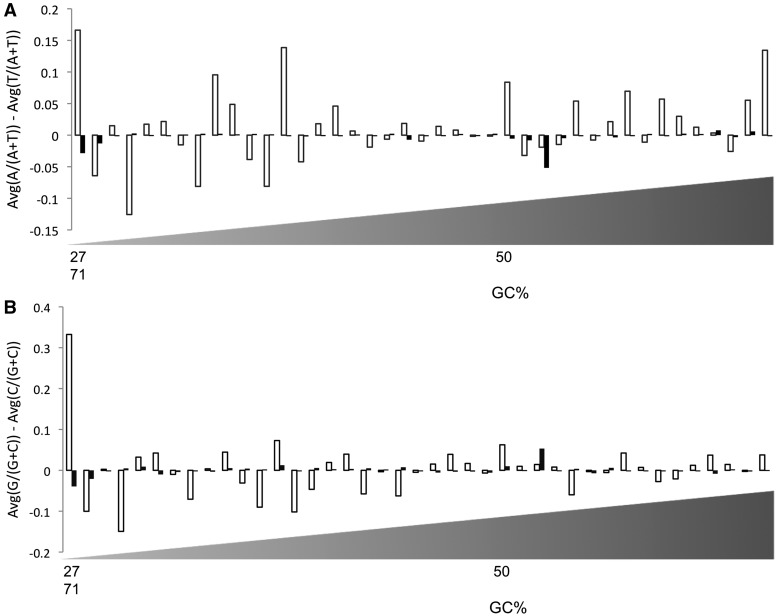
Prophages are phages in lysogeny that are integrated into, and replicated as part of, the host bacterial genome. These mobile elements can have tremendous impact on their bacterial hosts' genomes and phenotypes, which may lead to strain emergence and diversification, increased virulence or antibiotic resistance. However, finding prophages in microbial genomes remains a problem with no definitive solution. The majority of existing tools rely on detecting genomic regions enriched in protein-coding genes with known phage homologs, which hinders the de novo discovery of phage regions. In this study, a weighted phage detection algorithm, PhiSpy was developed based on seven distinctive characteristics of prophages, i.e. protein length, transcription strand directionality, customized AT and GC skew, the abundance of unique phage words, phage insertion points and the similarity of phage proteins. The first five characteristics are capable of identifying prophages without any sequence similarity with known phage genes. PhiSpy locates prophages by ranking genomic regions enriched in distinctive phage traits, which leads to the successful prediction of 94% of prophages in 50 complete bacterial genomes with a 6% false-negative rate and a 0.66% false-positive rate.


Figures

Figure 1.
Figure 1.
Orientation of proteins in 110 bacterial genomes (triangles) and 600 phages (x). Most of the phages have a large group of proteins facing in same direction and fewer proteins change their transcriptional directions. Bacteria, in contrast, cluster fewer proteins in the same direction and have high number of transcriptional direction changes.
Figure 2.
Figure 2.
Amino acid distribution in the predicted proteins encoded in 41 bacterial genomes (filled square) and their 190 prophages (open square). The amino acid utilization is similar for both but the standard deviation (vertical bars) is higher for prophages than for bacteria.
Figure 3.
Figure 3.
Frequency of codon usage in 41 bacterial genomes (filled square) with 190 prophages (open square). For some amino acids (notably, Asp, Glu, Phe, Gly, Lys, Pro, Arg), codon usage differs between prophages and their hosts’ genomes.
Figure 4.
Figure 4.
(A) Customized AT skew for 41 complete bacterial genomes (filled square) and their prophages (open square). The x-axis is sorted (ascending order) based on the genomes’ GC content as shown below the figure. (B) Customized GC skew for 41 complete bacterial genomes (filled square) and their prophages (open square). The x-axis is sorted (ascending order) based on the genomes’ GC content.
Figure 5.
Figure 5.
Average length of bacterial proteins (filled square) and phage proteins (open square) for 41 bacterial genomes and their prophages. Phage proteins are smaller than bacterial proteins. The x-axis is not sorted.
Figure 6.
Figure 6.
Comparison of the abundance of phage words in bacteria (triangles) and phage genomes (x). (A) The Shannon’s index (H) versus the frequency (F) of the presence of phage words for 600 complete phage genomes and 400 randomly chosen complete bacterial genomes. Both H and F are very small for bacterial genomes compared to phage genomes. The relationship between H and F for phages is F = 8.57 H + 0.047 with a regression coefficient R2 = 0.995 and for bacterial genome the relation is F = 5.85 H + 0.014 with a regression coefficient R2 = 0.993. (B) The ratio of the frequency and Shannon’s index, i.e. F/H for 600 complete phage genomes and 400 randomly chosen complete bacterial genomes. There is a statistically significant difference in F/H (abundance of phage words) between phages and bacteria.
Figure 7.
Figure 7.
(A) Comparative analysis of all prophages identified in 412 complete bacterial genomes by phiSpy, phage_finder and prophinder. (B) Comparative analysis of undefined prophages (no phage-like proteins) identified from 412 complete bacterial genomes.

References

    1. Casjens S. Prophages and bacterial genomics: what have we learned so far? Mol. Microbiol. 2003;49:277–300. - PubMed
    1. Casjens S, Palmer N, van Vugt R, Huang WM, Stevenson B, Rosa P, Lathigra R, Sutton G, Peterson J, Dodson RJ, et al. A bacterial genome in flux: the twelve linear and nine circular extrachromosomal DNAs in an infectious isolate of the Lyme disease spirochaete Borrelia burgdorferi. Mol. Microbiol. 2000;35:490–516. - PubMed
    1. Canchaya C, Proux C, Fournous G, Bruttin A, Brüssow H. Prophage genomics. Microbiol. Mol. Biol. Rev. 2003;67:238–276. - PMC - PubMed
    1. Mc Grath S, Van SD. Bacteriophage: Genetics and Molecular Biology. Norfolk, UK: Caister Academic Press; 2007.
    1. Aziz RK, Ismail S, Park HW, Kotb M. Post-proteomic identification of a novel phage-encoded streptodornase, Sda1, in invasive M1T1 Streptococcus pyogenes. Mol. Microbiol. 2004;54:184–197. - PubMed

Publication types