

Insulin clearance: confirmation as a highly heritable trait, and genome-wide linkage analysis
- PMID: 22584727
- PMCID: PMC3391346
- DOI: 10.1007/s00125-012-2577-2
Insulin clearance: confirmation as a highly heritable trait, and genome-wide linkage analysis
Abstract
Aims/hypothesis: We have previously documented a high heritability of insulin clearance in a Hispanic cohort. Here, our goal was to confirm the high heritability in a second cohort and search for genetic loci contributing to insulin clearance.
Methods: Hyperinsulinaemic-euglycaemic clamps were performed in 513 participants from 140 Hispanic families. Heritability was estimated for clamp-derived insulin clearance and a two-phase genome-wide linkage scan was conducted using a variance components approach. Linkage peaks were further investigated by candidate gene association analysis in two cohorts.
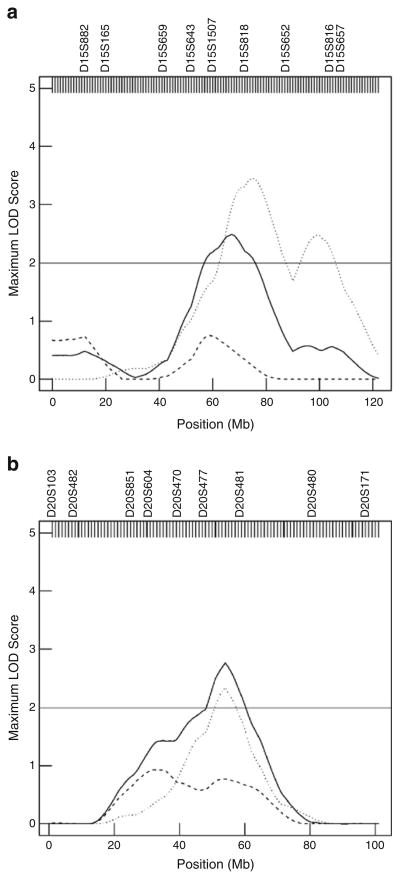
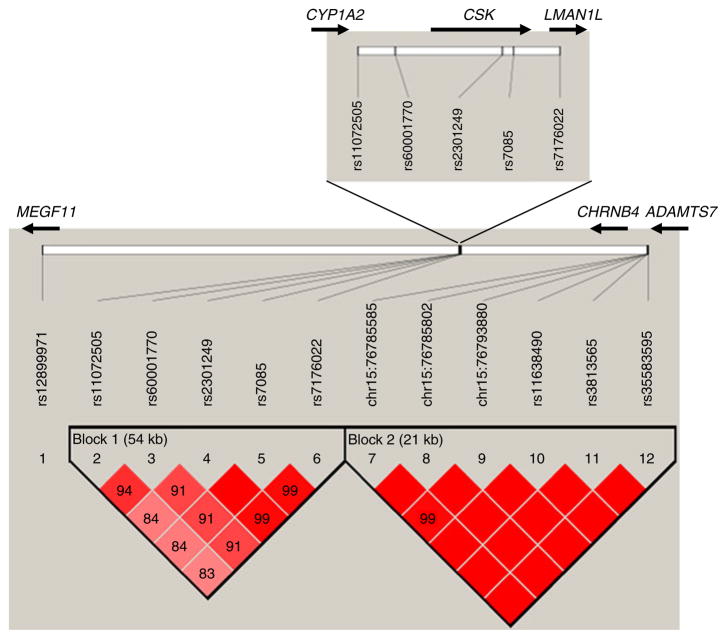
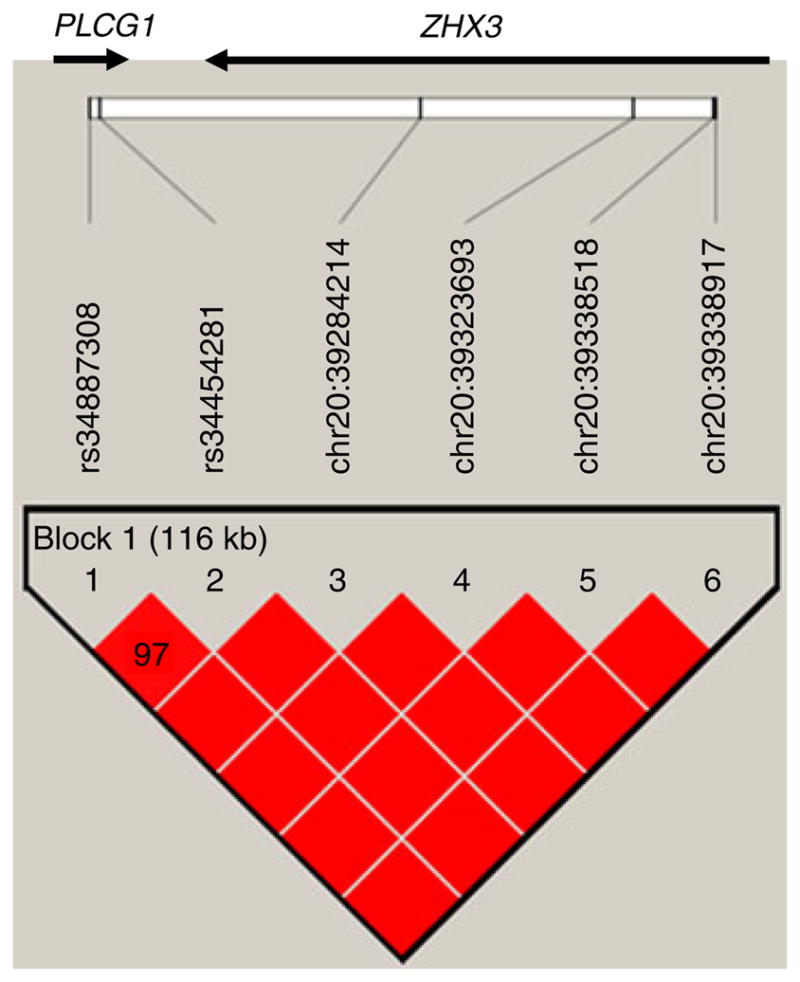
Results: The covariate-adjusted heritability of insulin clearance was 73%, indicating that the majority of the phenotypic variance is due to genetic factors. In the Phase 1 linkage scan, no signals with a logarithm of odds (LOD) score >2 were detected. In the Phase 2 scan, two linkage peaks with an LOD >2 for insulin clearance were identified on chromosomes 15 (LOD 3.62) and 20 (LOD 2.43). These loci harbour several promising candidate genes for insulin clearance, with 12 single nucleotide polymorphisms (SNPs) on chromosome 15 and six SNPs on chromosome 20 being associated with insulin clearance in both Hispanic cohorts.
Conclusions/interpretation: In a second Hispanic cohort, we confirmed that insulin clearance is a highly heritable trait and identified chromosomal loci that harbour genes regulating insulin clearance. The identification of such genes may improve our understanding of how the body clears insulin, thus leading to improved risk assessment, diagnosis, prevention and therapy of diabetes, as well as of other hyperinsulinaemic disorders, such as the metabolic syndrome and polycystic ovary syndrome.
Conflict of interest statement
Figures
References
-
- Narayan KM, Boyle JP, Thompson TJ, Sorensen SW, Williamson DF. Lifetime risk for diabetes mellitus in the United States. JAMA. 2003;290:1884–1890. - PubMed
-
- Cowie CC, Rust KF, Byrd-Holt DD, et al. Prevalence of diabetes and impaired fasting glucose in adults in the U.S. population: National Health and Nutrition Examination Survey 1999–2002. Diabetes Care. 2006;29:1263–1268. - PubMed
-
- Perry JR, Frayling TM. New gene variants alter type 2 diabetes risk predominantly through reduced beta-cell function. Curr Opin Clin Nutr Metab Care. 2008;11:371–377. - PubMed
Publication types
MeSH terms
Substances
Grants and funding
- R01 HL067974/HL/NHLBI NIH HHS/United States
- R01 HL088457/HL/NHLBI NIH HHS/United States
- UL1 TR000124/TR/NCATS NIH HHS/United States
- R01-DK079888/DK/NIDDK NIH HHS/United States
- P30 DK063491/DK/NIDDK NIH HHS/United States
- M01-RR000425/RR/NCRR NIH HHS/United States
- R01-HL067974/HL/NHLBI NIH HHS/United States
- M01 RR000425/RR/NCRR NIH HHS/United States
- M01 RR000043/RR/NCRR NIH HHS/United States
- UL1 TR000130/TR/NCATS NIH HHS/United States
- UL1-RR033176/RR/NCRR NIH HHS/United States
- UL1 RR033176/RR/NCRR NIH HHS/United States
- P50 HL055005/HL/NHLBI NIH HHS/United States
- TL1 RR033175/RR/NCRR NIH HHS/United States
- P50-HL055005/HL/NHLBI NIH HHS/United States
- P30-DK063491/DK/NIDDK NIH HHS/United States
- M01-RR000043/RR/NCRR NIH HHS/United States
- R01 DK079888/DK/NIDDK NIH HHS/United States
LinkOut - more resources
Full Text Sources
Medical
