. 2012 May 14;197(4):553-68.
doi: 10.1083/jcb.201111116.

Tks5-dependent formation of circumferential podosomes/invadopodia mediates cell-cell fusion

Affiliations

Tks5-dependent formation of circumferential podosomes/invadopodia mediates cell-cell fusion

Tsukasa Oikawa et al. J Cell Biol. .

Abstract

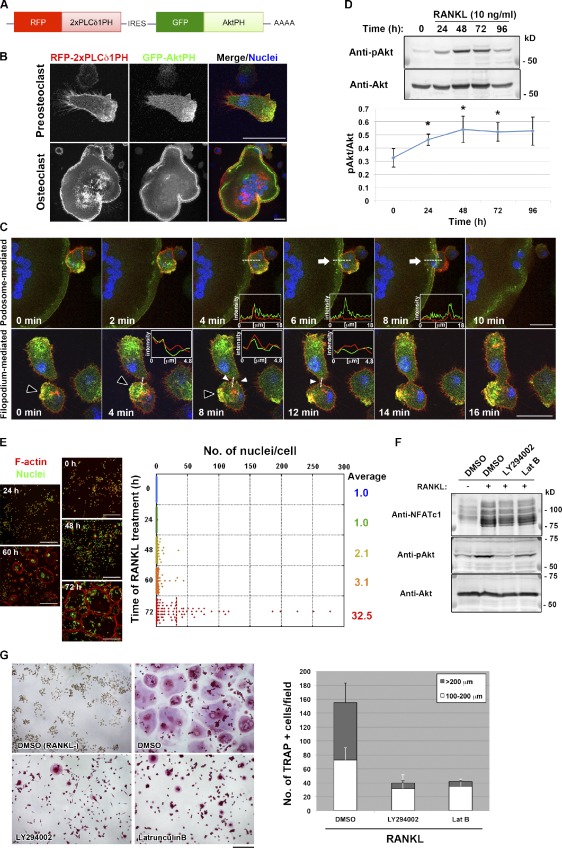
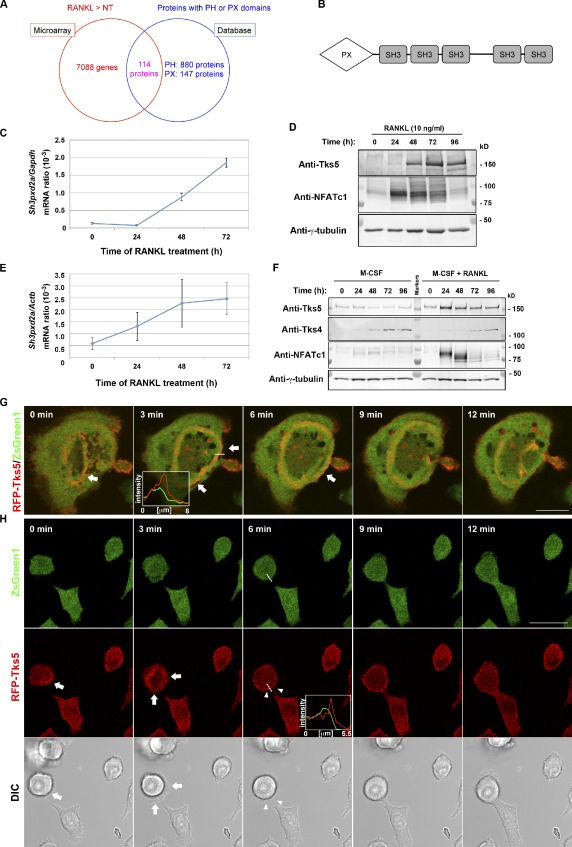
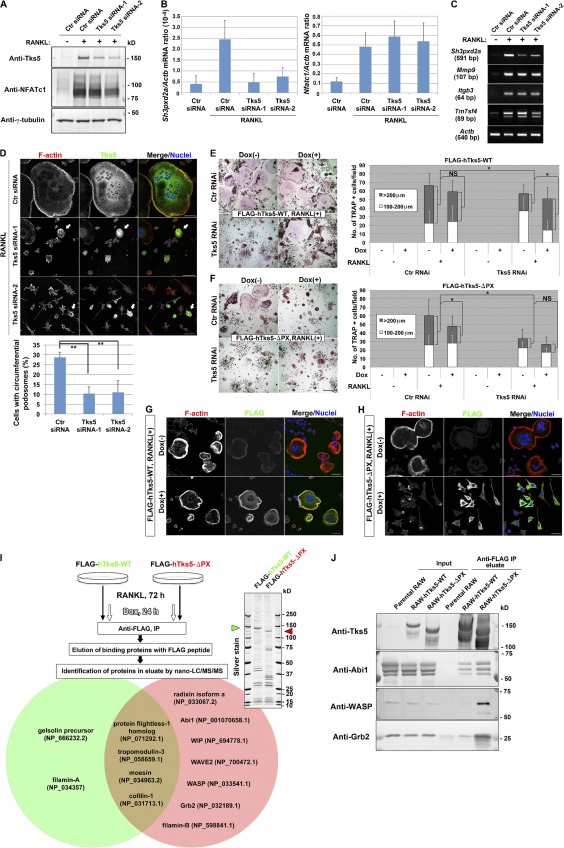
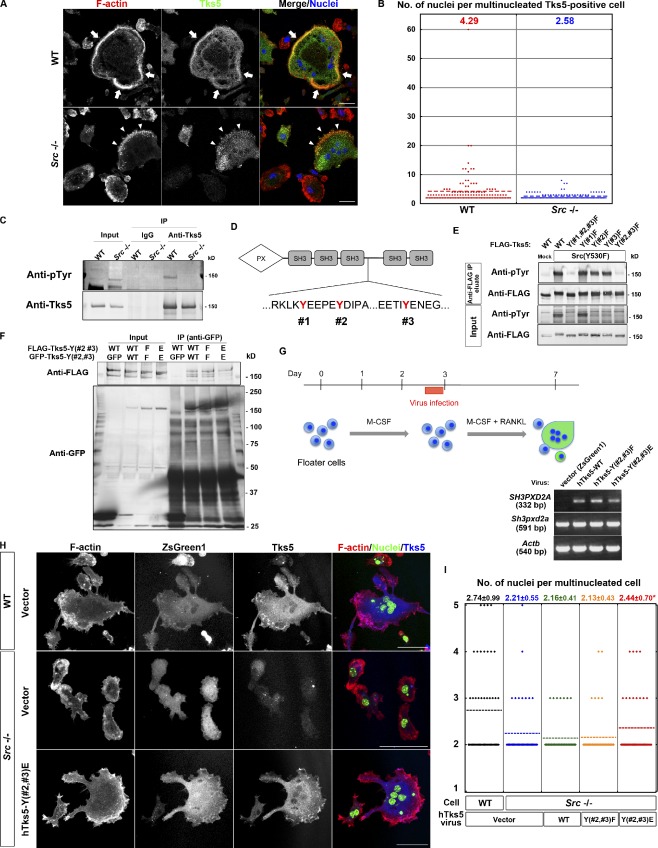
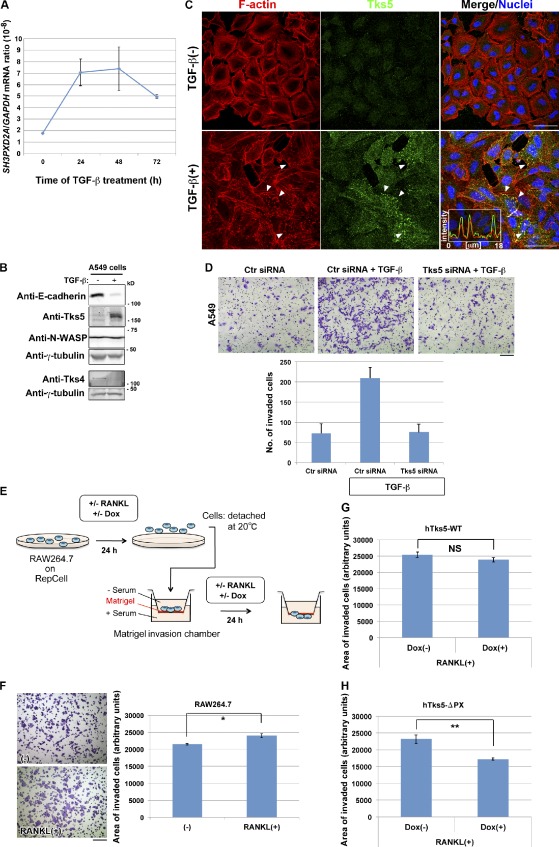
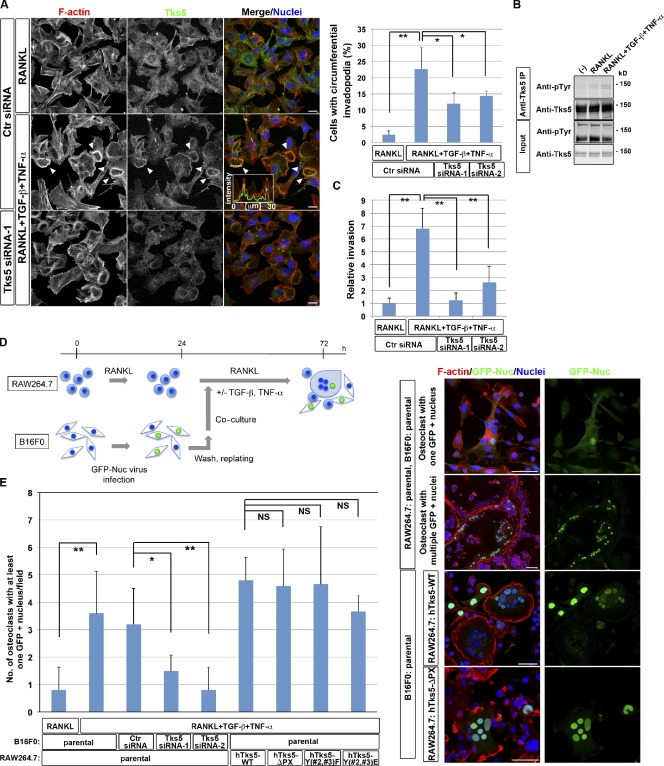
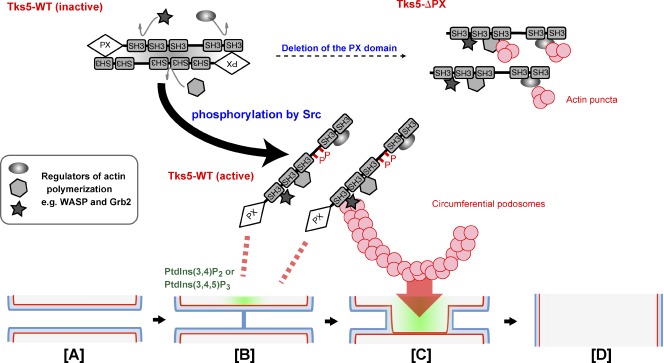
Osteoclasts fuse to form multinucleated cells during osteoclastogenesis. This process is mediated by dynamic rearrangement of the plasma membrane and cytoskeleton, and it requires numerous factors, many of which have been identified. The underlying mechanism remains obscure, however. In this paper, we show that Tks5, a master regulator of invadopodia in cancer cells, is crucial for osteoclast fusion downstream of phosphoinositide 3-kinase and Src. Expression of Tks5 was induced during osteoclastogenesis, and prevention of this induction impaired both the formation of circumferential podosomes and osteoclast fusion without affecting cell differentiation. Tyrosine phosphorylation of Tks5 was attenuated in Src-/- osteoclasts, likely accounting for defects in podosome organization and multinucleation in these cells. Circumferential invadopodia formation in B16F0 melanoma cells was also accompanied by Tks5 phosphorylation. Co-culture of B16F0 cells with osteoclasts in an inflammatory milieu promoted the formation of melanoma-osteoclast hybrid cells. Our results thus reveal an unexpected link between circumferential podosome/invadopodium formation and cell-cell fusion in and beyond osteoclasts.


Figures

Figure 1.
Figure 1.
Polarized membrane extensions mediate osteoclast fusion. (A) Schematic representation of the mRNA encoding the reporter constructs used for detection of PIs. IRES, internal ribosome entry site. (B) Live imaging of a mononuclear cell (top) and a multinuclear osteoclast (bottom) in RANKL-stimulated cultures of RAW264.7 cells expressing the reporter constructs in A. Cells were exposed to DAPI at 1 µg/ml (blue) for 1 h before observation to visualize nuclei. AktPH showed a polarized distribution, whereas PLCδ1PH was localized uniformly along the plasma membrane. (C) Live imaging of cells as in B during osteoclastogenesis. Arrows indicate a podosome-related protrusion in a multinucleated osteoclast. Closed and open arrowheads indicate a transient membrane expansion and filopodium-like protrusions, respectively. Pixel intensities on the traversing dashed lines were measured using LAS AF software and shown in the boxed areas (arbitrary units). See also Videos 1, 2, 3, and 4. (D, top) Immunoblot analysis of lysates of RAW264.7 macrophages stimulated with RANKL for the indicated times with antibodies to Ser473-phosphorylated (p) or total forms of Akt. (bottom) The pAkt/Akt signal intensity ratio was determined. Means ± SD from three independent experiments are indicated. *, P < 0.05 versus 0 h (Student’s t test). (E, left) RAW264.7 macrophages stimulated with RANKL for the indicated times were stained with rhodamine-phalloidin (red) to visualize F-actin and with DAPI (green) to visualize nuclei. (right) The distribution of the number of nuclei per cell was determined, with >100 cells counted at each time point. (F) RAW264.7 macrophages were stimulated with RANKL for 72 h, with the addition of 10 µM LY294002 or 0.1 µg/ml Latrunculin B (Lat B) for the last 16 h. DMSO was used as a vehicle control. Cell lysates were then subjected to immunoblot analysis with antibodies to NFATc1 or to Ser473-phosphorylated or total forms of Akt. (G, left) RAW264.7 macrophages treated with RANKL and inhibitors as in F were stained for TRAP activity. (right) The number of TRAP-positive cells with the indicated diameters was also determined. Data are means ± SD from three independent experiments. Bars: (B and C) 25 µm; (E) 250 µm; (G) 200 µm.
Figure 2.
Figure 2.
Tks5 as a potential mediator of fusion-competent protrusion formation. (A) Venn diagram summarizing the results of screening for molecules required for osteoclast fusion downstream of PI 3-kinase. Microarray analysis of RAW264.7 cells stimulated with 10 ng/ml RANKL for 72 h or not treated (NT) revealed 7,088 genes whose expression was up-regulated by RANKL, and database analysis yielded 1,027 proteins that contain a PH or PX domain; 114 proteins were present in both datasets. See also Tables S1 and S2. (B) Domain organization of Tks5. SH3, Src homology 3 domain. (C and D) RAW264.7 macrophages cultured in the presence of 10 ng/ml RANKL for the indicated times were subjected either to quantitative RT-PCR analysis of the amount of Sh3pxd2a mRNA (normalized by that of Gapdh mRNA; C) or to immunoblot analysis with antibodies to Tks5, to NFATc1, or to γ-tubulin (loading control; D). Quantitative data are means ± SD from three independent experiments. (E and F) Mouse bone marrow–derived macrophages cultured in the presence of 10 ng/ml M-CSF with or without 10 ng/ml RANKL for the indicated times were subjected either to quantitative RT-PCR analysis of the amount of Sh3pxd2a mRNA (normalized by that of Actb mRNA; E) or to immunoblot analysis with the indicated antibodies (F). Quantitative data are means ± SD from three independent experiments. (G and H) Live imaging of RAW264.7 macrophages expressing RFP-tagged mouse Tks5. Images were obtained after stimulation with 10 ng/ml RANKL for 48 h. ZsGreen1 was separately expressed as an internal control, and differential interference contrast (DIC) images were also obtained. Arrows indicate the outer edge of an expanding podosome (G) or transient expansion of a podosome-related protrusion (H). Arrowheads in H represent a fusing plasma membrane manifesting RFP-Tks5 accumulation at the plasma membrane. Pixel intensities on the traversing dashed lines were measured using LAS AF or FluoView software and shown in boxed areas (arbitrary units). Bars, 25 µm. See also Videos 5 and 6.
Figure 3.
Figure 3.
Tks5 plays an essential role in osteoclast fusion by generating circumferential podosomes. (A–D) RAW264.7 macrophages were transfected on a consecutive 2 d with control (Ctr) or one of two Tks5 siRNAs and were then stimulated with 10 ng/ml RANKL for 72 h. The cells were then subjected to immunoblot analysis (A), to quantitative RT-PCR analysis (B), or to semiquantitative RT-PCR analysis (C) as indicated. Data in B are means ± SD from three independent experiments. (D) The cells were also stained with rhodamine-phalloidin to visualize F-actin, with antibodies to Tks5, and with DAPI to visualize nuclei. Arrows indicate cells still expressing Tks5 that generate circumferential podosomes. (bottom) The percentage of cells with circumferential podosomes among >100 cells scored was also determined. Data are means ± SD from three independent experiments. **, P < 0.005 (Student’s t test). Bars, 50 µm. See also Fig. S1 A and Video 7. (E and F) RAW264.7 macrophages that express FLAG-tagged hTks5-WT or hTks5-ΔPX under the control of a Dox-responsive promoter were transfected with control or Tks5 siRNAs as described for A–D. They were then cultured in the absence or presence of 10 ng/ml RANKL or 1 µg/ml Dox for 72 h. TRAP-positive multinucleated osteoclasts of the indicated diameters were then identified and counted. Bars, 200 µm. Quantitative data are means ± SD from three independent experiments. *, P < 0.05 (Student’s t test). See also Fig. S1 (B–D). (G and H) RAW264.7 macrophages harboring Dox-sensitive FLAG–hTks5-WT (G) or FLAG–hTks5-ΔPX (H) constructs were cultured in the presence of RANKL with or without Dox for 72 h and were then stained with rhodamine-phalloidin (red), antibodies to FLAG, and DAPI (blue). Bars, 25 µm. (I) Binding proteins of hTks5-WT or hTks5-ΔPX were identified as described in the Materials and methods. A portion of the binding proteins was subjected to SDS-PAGE and silver staining. Green and red arrowheads indicate hTks5-WT and hTks5-ΔPX, respectively. Among the binding proteins identified, cytoskeletal proteins that associated with hTks5-WT or with hTks5-ΔPX are listed in the green and red circles, respectively. Accession numbers were obtained from the NCBI Protein database. (J) The binding proteins eluted as in I as well as the original cell lysates (Input) were also subjected to immunoblot analysis with the indicated antibodies. See also Fig. S1 E and Fig. S2 A. IP, immunoprecipitation; LC-MS/MS, liquid chromatography with tandem mass spectrometry; RAW, RAW264.7.
Figure 4.
Figure 4.
Phosphorylation by Src is required for Tks5 to induce circumferential podosomes and osteoclast fusion. (A) Representative images of multinucleated osteoclasts differentiated from spleen macrophages of WT or Src−/− mice. The cells were stained with rhodamine-phalloidin to visualize F-actin, with antibodies to Tks5, and with DAPI to visualize nuclei. Mononuclear cells tended to express little Tks5, whereas Tks5 was abundant in multinuclear cells. Arrows indicate a sealing belt, and arrowheads indicate actin puncta formed at the cell periphery. Bars, 25 µm. (B) Quantification of the number of nuclei per cell in multinucleated Tks5-positive osteoclasts differentiated from spleen macrophages of WT or Src−/− mice. More than 100 cells were counted, and the mean values are indicated. (C) Lysates of osteoclasts differentiated from spleen macrophages of WT or Src−/− mice were subjected to immunoprecipitation with antibodies to Tks5 or control IgG. The resulting precipitates, as well as the original cell lysates (Input), were then subjected to immunoblot analysis with antibodies to phosphotyrosine (pTyr) or to Tks5. (D) The amino acid sequences of hTks5 containing putative Src phosphorylation sites (#1, #2, and #3). (E) NIH 3T3 cells were cotransfected with a vector for FLAG-tagged hTks5-WT or mutants thereof with the indicated tyrosine residues replaced with phenylalanine together with a vector for an active form of Src, Src(Y530F), or the corresponding empty vector (Mock). Cell lysates were subjected to immunoprecipitation with agarose-conjugated antibodies to FLAG, and the precipitated proteins were eluted with the FLAG peptide. The eluted proteins, as well as the original cell lysates (Input), were subjected to immunoblot analysis with the indicated antibodies. (F) NIH 3T3 cells coexpressing GFP-tagged and FLAG-tagged forms of hTks5-WT or the indicated phenylalanine or glutamate substitution mutants were subjected to immunoprecipitation with antibodies to GFP. The resulting precipitates, as well as the original cell lysates (Input), were then subjected to immunoblot analysis with the indicated antibodies. See also Fig. S2 A. (G, top) Protocol for virus infection during osteoclastogenesis from primary spleen macrophages. (bottom) The infected osteoclasts were subjected to semiquantitative RT-PCR analysis to confirm the expression of hTks5 constructs. (H) Representative images of virus-infected (ZsGreen1 positive) osteoclasts differentiated from either WT or Src−/− spleen macrophages. The cells were stained with rhodamine-phalloidin (red), antibodies to Tks5, and DAPI (green). Bars, 50 µm. (I) Quantification of the number of nuclei per cell in multinucleated osteoclasts with ZsGreen1 expression. Means ± SD from three independent experiments are indicated. *, P < 0.05 versus Src−/− cells with the vector (Student’s t test). See also Fig. S2 B and Videos 8 and 9. IP, immunoprecipitation.
Figure 5.
Figure 5.
Induction of Tks5 is required for the promotion of invasive activity. (A and B) A549 pulmonary carcinoma cells cultured in the presence of 5 ng/ml TGF-β for the indicated times (A) or 72 h (B) were subjected to quantitative RT-PCR analysis of SH3PXD2A mRNA (A) or to immunoblot analysis with the indicated antibodies (B). Quantitative data are means ± SD from three independent experiments. (C) Representative images of A549 cells cultured in the absence or presence of TGF-β for 48 h. The cells were stained with rhodamine-phalloidin to visualize F-actin, with antibodies to Tks5, and with DAPI to visualize nuclei. Arrowheads indicate invadopodia-like structures showing Tks5 accumulation. Pixel intensities on the traversing dashed line were measured using LAS AF software and shown in a boxed area (arbitrary units). Bars, 50 µm. See also Video 10 for live imaging. (D) A549 cells transfected with control (Ctr) or Tks5 siRNAs were replated in Matrigel chambers and assayed for invasive activity in the absence or presence of TGF-β. Cells that had invaded through the Matrigel at 18 h after plating were stained with crystal violet (top), and those in three different sampling areas were counted. Bar, 200 µm. Quantitative data are means ± SD from three independent experiments. See also Fig. S3 A for immunoblot. (E) Experimental protocol for Matrigel invasion assays with RAW264.7 macrophages. (F–H) Control RAW264.7 macrophages (F) or those harboring Dox-sensitive constructs for hTks5-WT (G) or hTks5-ΔPX (H) were subjected to invasion assays as in E. Cells that invaded through the Matrigel were stained with crystal violet (F), and the area occupied by the invaded cells in three different sampling regions in a single chamber was quantified. Bar, 200 µm. The minus sign indicates no stimulus added to the culture. Data are means ± SEM for six independent experiments. *, P < 0.02; **, P < 0.002 (Student’s t test).
Figure 6.
Figure 6.
Circumferential podosomes/invadopodia mediate invasive and fusion activities. (A) B16F0 murine melanoma cells transfected with control (Ctr) or Tks5 siRNAs were cultured in the presence of 10 ng/ml RANKL alone or together with 5 ng/ml TGF-β and 5 ng/ml TNF-α for 48 h. (left) The cells were then stained with rhodamine-phalloidin to visualize F-actin, with antibodies to Tks5, and with DAPI to visualize nuclei. Arrowheads indicate circumferential invadopodia. Pixel intensities on the traversing dashed line were measured using LAS AF software and shown in a boxed area (arbitrary units). Bars, 25 µm. (right) The percentage of cells with circumferential invadopodia among >100 cells scored was also determined. Data are means ± SD from three independent experiments. *, P < 0.05; **, P < 0.001 (Student’s t test). See also Fig. S3 B for immunoblot. (B) B16F0 cells cultured in the presence of 10 ng/ml RANKL alone or together with 5 ng/ml TGF-β and 5 ng/ml TNF-α for 48 h were subjected to immunoprecipitation with antibodies to Tks5, and the resulting precipitates as well as the original cell lysates (Input) were subjected to immunoblot analysis with the indicated antibodies. The minus sign indicates no stimulus added to the culture. (C) B16F0 cells transfected with control (Ctr) or Tks5 siRNAs were cultured in the presence of 10 ng/ml RANKL alone or together with 5 ng/ml TGF-β and 5 ng/ml TNF-α for 48 h. The cells were then replated in Matrigel chambers and assayed for invasive activity in the same conditions. Cells that had invaded through the Matrigel at 24 h after plating were stained with crystal violet, and those in three different sampling areas were counted. Data are means ± SD from three independent experiments. **, P < 0.001 (Student’s t test). (D, left) Experimental protocol for co-culture of B16F0 melanoma cells and osteoclasts derived either from parental RAW264.7 macrophages or from those expressing hTks5-WT, hTks5-ΔPX, hTks5-Y(#2,#3)F, or hTks5-Y(#2,#3)E. See also the Materials and methods section for details. (right) The cultures were then stained with rhodamine-phalloidin (red), antibodies to GFP, and DAPI (blue). Bars, 50 µm. (E) Quantification of the number of osteoclasts harboring at least one GFP-positive nucleus after co-culture with B16F0 cells on an 11 × 22–mm coverslip as in D. Data are means ± SD from more than three independent experiments. *, P < 0.05; **, P < 0.01 (Student’s t test). IP, immunoprecipitation.
Figure 7.
Figure 7.
Model for Tks5 activation and cell–cell fusion mediated by circumferential podosomes/invadopodia. Tks5 is activated by binding to PtdIns(3,4)P2 or PtdIns(3,4,5)P3 through its PX domain as well as by phosphorylation by Src, resulting in the adoption of an “open” conformation amenable to interaction with other proteins. Activated Tks5 then promotes the formation of circumferential podosomes/invadopodia. Membranes thus are brought into close proximity [A], and the two outer leaflets (blue) fuse to form a hemifusion stalk [B]. The hemifusion stalk then expands to form a hemifusion diaphragm, with the inner leaflets (red) being in contact [C]. Rupture of the hemifusion diaphragm results in formation of the fusion pore [D]. Production of PtdIns(3,4)P2 or PtdIns(3,4,5)P3 (green) may trigger the latter steps by inducing the Tks5-dependent formation of circumferential podosomes/invadopodia.

Similar articles

Cited by

References

    1. Abram C.L., Seals D.F., Pass I., Salinsky D., Maurer L., Roth T.M., Courtneidge S.A. 2003. The adaptor protein fish associates with members of the ADAMs family and localizes to podosomes of Src-transformed cells. J. Biol. Chem. 278:16844–16851 10.1074/jbc.M300267200 - DOI - PubMed
    1. Ammer A.G., Weed S.A. 2008. Cortactin branches out: roles in regulating protrusive actin dynamics. Cell Motil. Cytoskeleton. 65:687–707 10.1002/cm.20296 - DOI - PMC - PubMed
    1. Andersen T.L., Boissy P., Sondergaard T.E., Kupisiewicz K., Plesner T., Rasmussen T., Haaber J., Kølvraa S., Delaissé J.M. 2007. Osteoclast nuclei of myeloma patients show chromosome translocations specific for the myeloma cell clone: a new type of cancer-host partnership? J. Pathol. 211:10–17 10.1002/path.2078 - DOI - PubMed
    1. Andersen T.L., Søe K., Sondergaard T.E., Plesner T., Delaisse J.M. 2010. Myeloma cell-induced disruption of bone remodelling compartments leads to osteolytic lesions and generation of osteoclast-myeloma hybrid cells. Br. J. Haematol. 148:551–561 10.1111/j.1365-2141.2009.07980.x - DOI - PubMed
    1. Buschman M.D., Bromann P.A., Cejudo-Martin P., Wen F., Pass I., Courtneidge S.A. 2009. The novel adaptor protein Tks4 (SH3PXD2B) is required for functional podosome formation. Mol. Biol. Cell. 20:1302–1311 10.1091/mbc.E08-09-0949 - DOI - PMC - PubMed

Publication types