

Optimal dosing of miltefosine in children and adults with visceral leishmaniasis
- PMID: 22585212
- PMCID: PMC3393397
- DOI: 10.1128/AAC.00292-12
Optimal dosing of miltefosine in children and adults with visceral leishmaniasis
Abstract
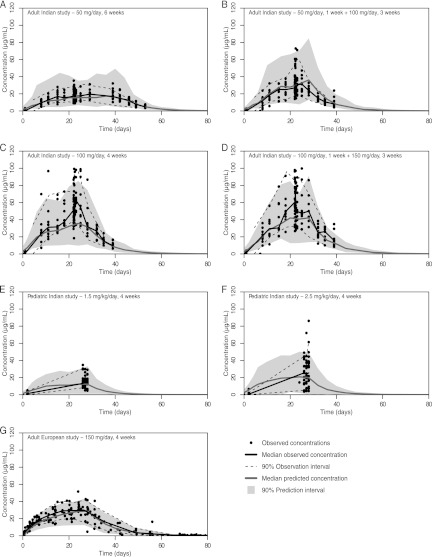
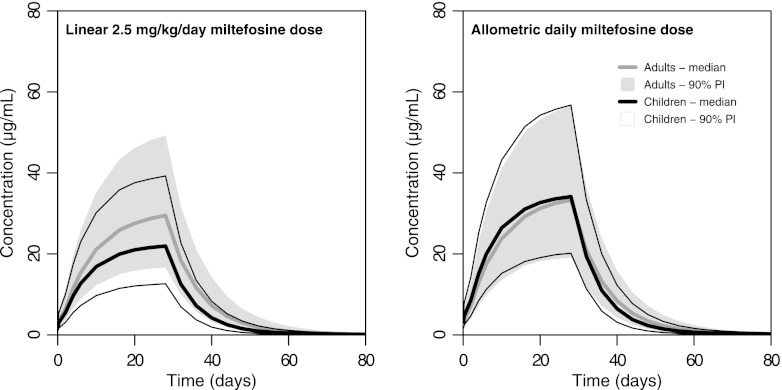
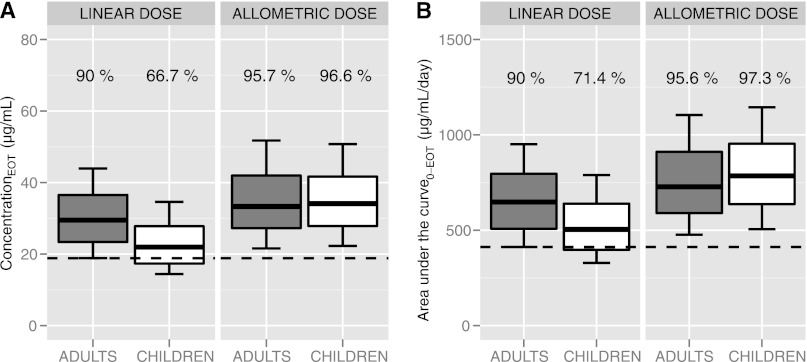
Only anecdotal data are available on the pharmacokinetics (PK) of miltefosine in children suffering from visceral leishmaniasis (VL). While failure rates were higher in children with VL, steady-state concentrations appeared lower than those seen with adults. We hypothesized that the current linear dosage (in milligrams per kilogram of body weight) is too low for children and that a new dosing algorithm based on an appropriate body size model would result in an optimal exposure. A population PK analysis was performed on three historic pooled data sets, including Indian children, Indian adults, and European adults. Linear and allometric scaling of PK parameters by either body weight or fat-free mass (FFM) was evaluated for body size models. Based on the developed PK model, a dosing algorithm for miltefosine in children and adults was proposed and evaluated in silico. The population PK model employing allometric scaling fitted best to the pooled miltefosine data. Allometric scaling by FFM reduced between-subject variability, e.g., for drug clearance, from 49.6% to 32.1%. A new allometric miltefosine dosing algorithm was proposed. Exposure to miltefosine was lower in children than adults receiving 2.5 mg/kg/day: a C(max) of 18.8 μg/ml was reached by 90% of adults and 66.7% of children. The allometric daily dose resulted in similar levels of exposure to miltefosine for adults and children. The use of a new allometric dosing algorithm for miltefosine in VL patients results in optimal exposure to miltefosine in both adults and children and might improve clinical outcome in children.
Figures
Similar articles
-
Pharmacokinetics, Safety, and Efficacy of an Allometric Miltefosine Regimen for the Treatment of Visceral Leishmaniasis in Eastern African Children: An Open-label, Phase II Clinical Trial.Clin Infect Dis. 2019 Apr 24;68(9):1530-1538. doi: 10.1093/cid/ciy747. Clin Infect Dis. 2019. PMID: 30188978 Free PMC article. Clinical Trial.
-
Characterizing the non-linear pharmacokinetics of miltefosine in paediatric visceral leishmaniasis patients from Eastern Africa.J Antimicrob Chemother. 2020 Nov 1;75(11):3260-3268. doi: 10.1093/jac/dkaa314. J Antimicrob Chemother. 2020. PMID: 32780098 Free PMC article.
-
Failure of miltefosine in visceral leishmaniasis is associated with low drug exposure.J Infect Dis. 2014 Jul 1;210(1):146-53. doi: 10.1093/infdis/jiu039. Epub 2014 Jan 16. J Infect Dis. 2014. PMID: 24443541
-
Treatment of leishmaniasis with miltefosine: 2008 status.Expert Opin Drug Metab Toxicol. 2008 Sep;4(9):1209-16. doi: 10.1517/17425255.4.9.1209. Expert Opin Drug Metab Toxicol. 2008. PMID: 18721114 Review.
-
[Miltefosine: a new remedy for leishmaniasis].Ned Tijdschr Geneeskd. 2006 Dec 9;150(49):2697-701. Ned Tijdschr Geneeskd. 2006. PMID: 17194005 Review. Dutch.
Cited by
-
Fixed-Dose Combination Formulations in Solid Oral Drug Therapy: Advantages, Limitations, and Design Features.Pharmaceutics. 2024 Jan 26;16(2):178. doi: 10.3390/pharmaceutics16020178. Pharmaceutics. 2024. PMID: 38399239 Free PMC article. Review.
-
Study on the safety and efficacy of miltefosine for the treatment of children and adolescents with post-kala-azar dermal leishmaniasis in Bangladesh, and an association of serum vitamin E and exposure to arsenic with post-kala-azar dermal leishmaniasis: an open clinical trial and case-control study protocol.BMJ Open. 2016 May 17;6(5):e010050. doi: 10.1136/bmjopen-2015-010050. BMJ Open. 2016. PMID: 27188804 Free PMC article.
-
Skin pharmacokinetics of miltefosine in the treatment of post-kala-azar dermal leishmaniasis in South Asia.J Antimicrob Chemother. 2024 Jul 1;79(7):1547-1554. doi: 10.1093/jac/dkae129. J Antimicrob Chemother. 2024. PMID: 38727613 Free PMC article.
-
Paromomycin and Miltefosine Combination as an Alternative to Treat Patients With Visceral Leishmaniasis in Eastern Africa: A Randomized, Controlled, Multicountry Trial.Clin Infect Dis. 2023 Feb 8;76(3):e1177-e1185. doi: 10.1093/cid/ciac643. Clin Infect Dis. 2023. PMID: 36164254 Free PMC article. Clinical Trial.
-
Low antileishmanial drug exposure in HIV-positive visceral leishmaniasis patients on antiretrovirals: an Ethiopian cohort study.J Antimicrob Chemother. 2021 Apr 13;76(5):1258-1268. doi: 10.1093/jac/dkab013. J Antimicrob Chemother. 2021. PMID: 33677546 Free PMC article.
References
-
- Ambrose PG, et al. 2009. Use of a clinically derived exposure-response relationship to evaluate potential tigecycline-Enterobacteriaceae susceptibility breakpoints. Diagn. Microbiol. Infect. Dis. 63:38–42 - PubMed
-
- Anderson BJ, Holford NHG. 2008. Mechanism-based concepts of size and maturity in pharmacokinetics. Annu. Rev. Pharmacol. Toxicol. 48:303–332 - PubMed
-
- Anderson BJ, McKee AD, Holford NH. 1997. Size, myths and the clinical pharmacokinetics of analgesia in paediatric patients. Clin. Pharmacokinet. 33:313–327 - PubMed
-
- Anderson BJ, Holford NHG. 2009. Mechanistic basis of using body size and maturation to predict clearance in humans. Drug Metab. Pharmacokinet. 24:25–36 - PubMed
Publication types
MeSH terms
Substances
LinkOut - more resources
Full Text Sources
