. 2012 Jul;42(7):1767-77.
doi: 10.1002/eji.201142164.

Freeze-thaw lysates of Plasmodium falciparum-infected red blood cells induce differentiation of functionally competent regulatory T cells from memory T cells

Affiliations
Free PMC article

Freeze-thaw lysates of Plasmodium falciparum-infected red blood cells induce differentiation of functionally competent regulatory T cells from memory T cells

Olivia C Finney et al. Eur J Immunol. 2012 Jul.
Free PMC article

Abstract

In addition to naturally occurring regulatory T (nTreg) cells derived from the thymus, functionally competent Treg cells can be induced in vitro from peripheral blood lymphocytes in response to TCR stimulation with cytokine costimulation. Using these artificial stimulation conditions, both naïve as well as memory CD4(+) T cells can be converted into induced Treg (iTreg) cells, but the cellular origin of such iTreg cells in vivo or in response to more physiologic stimulation with pathogen-derived antigens is less clear. Here, we demonstrate that a freeze/thaw lysate of Plasmodium falciparum schizont extract (PfSE) can induce functionally competent Treg cells from peripheral lymphocytes in a time- and dose-dependent manner without the addition of exogenous costimulatory factors. The PfSE-mediated induction of Treg cells required the presence of nTreg cells in the starting culture. Further experiments mixing either memory or naïve T cells with antigen presenting cells and CFSE-labeled Treg cells identified CD4(+) CD45RO(+) CD25(-) memory T cells rather than Treg cells as the primary source of PfSE-induced Treg cells. Taken together, these data suggest that in the presence of nTreg cells, PfSE induces memory T cells to convert into iTreg cells that subsequently expand alongside PfSE-induced effector T cells.


Figures

Figure 1
Figure 1
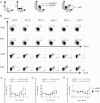
Treg cells are induced and activated by P. falciparum schizont extract (PfSE). PBMCs were cultured for up to 7 days with growth medium (GM), uninfected red blood cells (uRBCs), or PfSE (PfSE, at a 2 parasite:1 PBMC ratio, equivalent to 2 × 10⁶ parasites/mL). Cells were stained for CD4, CD25, CD127, and FOXP3 and the percentage of FOXP3+CD127lo/− and CD25+FOXP3CD4+ cells was determined ex vivo, and after 2, 3, 4, 5, 6, and 7 days of culture. (A) Lymphocytes were gated, followed by CD4+ cells. Treg cells were defined as CD4+FOXP3+CD127lo/− cells. In order to draw this gate, cells were first gated on CD4+FOXP3+ cells, and the CD127lo/+ cutoff was determined on the CD4+FOXP3+ population, where two populations are clearly visible. These gates were then applied to CD4+ T cells, displayed as FOXP3 versus CD127. On this plot, FOXP3+CD127lo/− cells were further divided into FOXP3hi and FOXP3lo-expressing cells. T effector (Teff) cells were defined as CD4+CD25+FOXP3. (B) Representative stainings of PBMCs from one of five donors, treated and gated as in (A). The kinetics of (C) CD4+FOXP3hiCD127lo/−, (D) CD4+FOXP3loCD127lo/−Treg, and (E) Teff cells (CD4+CD25+FOXP3) in response to uRBCs and PfSE are shown. Expression levels on day 0 were set to “1”, and values measured on subsequent days were expressed as a fold change compared to day 0. Data are based on the collection of 50,000 lymphocytes. Data are shown as mean ± SEM of values from five donors (each tested twice in independent experiments). R values and p values are derived from regression analysis.
Figure 2
Figure 2
Treg cells are induced and activated by PfSE in a dose-dependent manner. PBMCs were cultured for 6 days with different concentrations of PfSE (103, 104, 105, 106, 107 parasites/mL). Uninfected red blood cells were used as a control. On day 6, cells were stained for CD4, CD25, CD127, and FOXP3. (A) Representative staining using the gating strategy defined in Fig. 1A. The level of (B) FOXP3hi (circles) and FOXP3lo (squares) CD4+FOXP3+CD127lo/− cells, and (C) T effector cells (CD4+CD25+FOXP3) is shown, expressed as the ratio of cells measured in PfSE/uRBC stimulated wells. In (D), the ratio of Teff:CD4+FOXP3hiCD127lo/− cells is shown. Data are based on the collection of 50,000 lymphocytes. Data are shown as ± SEM from five donors, each tested twice in independent experiments. R values and p values derived from regression analysis.
Figure 3
Figure 3
Induced Treg cells suppress proliferation. PBMCs were cultured for 6 days with GM, uRBCs, or PfSE. Cells were separated into CD25+ and CD25 PBMCs using Miltenyi CD25 beads. CD25+ and CD25 were cultured in triplicate wells in 96 well plates in different ratios (0:1, 1:20, 1:4, 1:1) and incubated with CD3/CD28. Cells were incubated for a further 18 h with 3H-thymidine before being analyzed in a scintillation counter. The proliferation was measured as counts per minute, and normalized on proliferation in wells containing CD25 cells only. (A) The median and interquartile range of values from five donors (each tested twice in independent experiments) is shown. R values and p values derived from linear regression analysis (df = 18). The proportion of CD4+CD25+CD127lo/− cells among isolated CD25+ cells expressing either (B) high or (C) low levels of FOXP3 is shown for uRBC- and PfSE-stimulated cultures. Box plots show median and interquartile ranges with whiskers indicating the 5 and 95% percentiles from five donors, each tested twice in independent experiments.
Figure 4
Figure 4
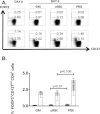
Depletion of nTreg cells abrogates the induction of Treg cells. PBMCs were depleted of CD25+ cells using Miltenyi CD25 beads (depletion of 96.41% [CI 95% 95.25–97.57], resulting in 75.78% (CI 95% 66.42–85.13) Treg-cell depleted). CD25 PBMCs and mock-depleted PBMCs were cultured for 6 days with GM, uRBCs, and PfSE. On day 6, cells were stained with CD4, CD25, CD127, and FOXP3. (A) Representative staining of CD25-depleted (top panel) and mock-depleted (bottom panel) cells. (B) After 6 days of culture, the percentage of CD4+FOXP3+CD127lo/− cells was determined in the depleted (filled bars) and the mock-depleted cells (open bars). The white area of the bar represents the proportion of CD4+FOXP3loCD127lo/−cells, the striped area represents the proportion of CD4+FOXP3hiCD127lo/-cells. Data are based on the collection of 50,000 lymphocytes. Data are shown as ± SEM from five donors, each tested twice in independent experiments. p values calculated using the Mann–Whitney test.
Figure 5
Figure 5
PfSE stimulation induces iTreg cells from Tmem cells. The proportion of viable CD4+ T cells expressing a Treg-cell phenotype after 5 days culture is shown for PBMCs stimulated with (A) uRBCs, (B) PfSE, (C) anti-CD3, and TGFβ, for the cell mix containing “Tnaive” + “APC” + “Treg”, stimulated with (D) uRBCs, (E) PfSE; for the cell mix containing “Tmem” + “APC” + “Treg,” stimulated with (F) uRBCs, (G)PfSE; and for (H) CFSE-labeled “Treg” stimulated with SEB. (I–M) The histograms depict the proportion of CFSE+/− cells expressing a Treg-cell phenotype gated in the corresponding graphs (D–H). A summary of the proportion of viable CD4+ T cells expressing a Treg-cell phenotype prior to and after culture is shown for (N) PBMCs, (O) the cell mix containing “Tnaive” + “APC” + “Treg cells” and (P) “Tmem” + “APC” + “Treg cells.” (Q) The proportion of CFSE-negative cells expressing a Treg-cell phenotype prior to and after culture is shown for the cell mixes containing either naïve or Tmem cells. Data are shown as mean ± SEM. Representative plots from one of three experiments are shown in A to H.
Figure 6
Figure 6
Model for induction of Treg cells in response to antigenic stimulation. In the appropriate cytokine environment, and upon presentation of their cognate antigen memory T (Tmem) cells convert into (A) effector T (Teff) cells, or (B) induced Treg (iTreg) cells. The formation of the latter requires contact of the Tmem cells with a preexisting Treg cells (which may involve membrane-bound TGF-β, activated by the parasite). Both Teff and iTreg cells subsequently proliferate in a balanced manner.

Similar articles

Cited by

References

    1. Sakaguchi S. Naturally arising Foxp3-expressing CD25+CD4+ regulatory T cells in immunological tolerance to self and non-self. Nat. Immunol. 2005;6:345–352. - PubMed
    1. Mills KHG. Regulatory T cells: friend or foe in immunity to infection? Nat. Rev. Immunol. 2004;4:841–855. - PubMed
    1. Belkaid Y, Blank RB, Suffia I. Natural regulatory T cells and parasites: a common quest for host homeostasis. Immunol. Rev. 2006;212:287–300. - PubMed
    1. Chen W, Jin W, Hardegen N, Lei KJ, Li L, Marinos N, McGrady G, et al. Conversion of peripheral CD4+CD25- naive T cells to CD4+CD25+ regulatory T cells by TGF-beta induction of transcription factor Foxp3. J. Exp. Med. 2003;198:1875–1886. - PMC - PubMed
    1. Bluestone JA, Abbas AK. Natural versus adaptive regulatory T cells. Nat. Rev. Immunol. 2003;3:253–257. - PubMed

Publication types

MeSH terms