. 2012 Jun 4;209(6):1183-99.
doi: 10.1084/jem.20112667. Epub 2012 May 14.

Spatiotemporally separated antigen uptake by alveolar dendritic cells and airway presentation to T cells in the lung

Affiliations

Spatiotemporally separated antigen uptake by alveolar dendritic cells and airway presentation to T cells in the lung

Emily E Thornton et al. J Exp Med. .

Abstract

Asthma pathogenesis is focused around conducting airways. The reasons for this focus have been unclear because it has not been possible to track the sites and timing of antigen uptake or subsequent antigen presentation to effector T cells. In this study, we use two-photon microscopy of the lung parenchyma and note accumulation of CD11b(+) dendritic cells (DCs) around the airway after allergen challenge but very limited access of these airway-adjacent DCs to the contents of the airspace. In contrast, we observed prevalent transepithelial uptake of particulate antigens by alveolar DCs. These distinct sites are temporally linked, as early antigen uptake in alveoli gives rise to DC and antigen retention in the airway-adjacent region. Antigen-specific T cells also accumulate in the airway-adjacent region after allergen challenge and are activated by the accumulated DCs. Thus, we propose that later airway hyperreactivity results from selective retention of allergen-presenting DCs and antigen-specific T cells in airway-adjacent interaction zones, not from variation in the abilities of individual DCs to survey the lung.


Figures
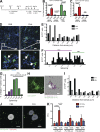
Figure 1.
Figure 1.
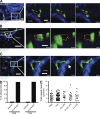
Specific accumulation of CD11b+ DCs near allergic airways. (A) Method for inducing allergic airway inflammation involving three i.p. sensitizations with OVA/alum followed by three i.n. administrations of either OVA or PBS. (B) Quantification of CD11b+ DCs, CD103+ DCs, and AMs as a percentage of live leukocytes based on CD11c surface antibody staining in lungs of PBS- and OVA-challenged mice. (C) Quantification of CD11b+ DC and CD103+ DC populations as a percentage of live leukocytes gated on CD11c-EYFPhi cells in PBS- and OVA-challenged mice. (D) Large-scale three-dimensional surveys of >300-µm slices from CD11c-EYFP mice stained with Hoechst shows DC and AM distribution in PBS- and OVA-challenged mice obtained by two-photon microscopy with 910-nm excitation. Insets provide a zoomed in view of the two distinct morphologies. AW, airway. (E) Quantification of CD11c-EYFP+ cells near the airways in PBS- or OVA-challenged mice. (F) Measurement of sphericity to separate DCs from AMs. AMs were defined as having a sphericity >0.75. (G) Imaris was used to make surfaces of Siglec-F+ CD11c-EYFP+ cells from OVA-challenged mice. The sphericity of these cells is graphed, showing that ∼80% of Siglec-F–stained AMs are captured by the sphericity measurement. (H) Color coding of localization based on sphericity with bulk CD11c-EYFP data shown on the left and subdivided data (DCs, purple; AMs, green; airway, white) on the right from an OVA-challenged mouse. (I) Images were subdivided by sphericity to determine whether DCs or AMs account for the accumulation within 75 µm of the airway after OVA challenge. (J) Example images from CD11c-EYFP sections (gated on EYFP+ sphericity <0.75) stained with CD11b APC. Bars: (D [top] and H) 100 µm; (D, bottom) 10 µm; (J) 150 µm. (K) Quantification of CD11b+ and CD11b DC distance from the nearest airway for PBS- and OVA-challenged mice. (B, C, and K) Error bars represent SEM. Graphs represent at least five mice per group from at least three independent experiments. Images are representative data from at least three independent experiments.
Figure 2.
Figure 2.
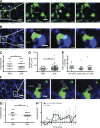
Airway and alveolar DCs exhibit different behaviors. (A) Detailed image with overlaid tracks of cell motility at airway surfaces and alveolar spaces over the course of 2 h. The top half of the image is mostly alveoli, whereas the bottom is mostly airway. Arrows indicate alveolar DCs. Bar, 100 µm. (B) Track speed means calculated using Imaris for CD11c-EYFP DCs and AMs separated by airway and alveolar location in PBS and OVA challenge conditions. Each dot represents one cell. Error bars represent SEM. (C) Mean squared displacements ± SE as a function of time for alveolar or airway-adjacent DCs from untreated mice. (D) 30-min displacement for alveolar DCs from OVA-challenged mice with a 5-µm cutoff, which is the diameter of one cell. Each dot represents one cell. Data are from at least three independent experiments.
Figure 3.
Figure 3.
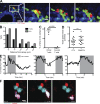
Airway DCs are motile but send few processes through the epithelium. (A) Standard motility of airway-adjacent DCs. Entire field for orientation (left) followed by zoomed images from relevant regions collected at the indicated times. (B) Sentinel-like motility of CD11c-EYFP cells on the inner surface of an airway obtained using two-photon microscopy and rendered in Imaris. (A and B) Yellow and red lines indicate tracks of two airway-adjacent DCs over a 30-min time lapse. (C) Process-forming DCs marked by CD11c-EYFP in Actin-CFP background. Process to probe epithelium is indicated by an arrow. Bars: (A, left) 25 µm; (A and C, right) 15 µm; (B and C, left) 50 µm; (B, right) 10 µm. Time stamps are shown in minutes/seconds. (D) Quantification of processes from airway DCs across airway epithelium in PBS- or OVA-challenged mice. (E) Track speed means of airway DCs from PBS- or OVA-challenged mice, before LPS treatment or after 10 min or 3 h of LPS treatment. Each dot represents one cell. Error bars represent SEM. Images are representative images from >12 mice per group. Quantification of track speed means are combined data from three separate experiments.
Figure 4.
Figure 4.
DCs sweep the alveolar air space using transepithelial dendrites. (A) Motility of CD11c-EYFP DCs in the alveolus of an OVA-challenged mouse stained with Hoechst. The arrow indicates an extended dendrite. (B) Alveolar motility of a CD11c-EYFP DC in a PBS-treated Actin-CFP mouse. (C) Quantification of dendrite numbers per alveolar DC for PBS- and OVA-challenged lungs. (D) Surface area of alveolar DCs from PBS- and OVA-challenged mice calculated using the isosurface tool in Imaris. (E) Track speed means of alveolar DCs before LPS treatment or after 10 min or 3 h of LPS treatment. (F) Intravital in vivo motility of a CD11c-EYFP DC in the alveolus of an Actin-CFP mouse that is anesthetized, ventilated, and imaged with two-photon microscopy. (B and F) Dotted lines trace the dendrite surface. Bars: (A, B, and F, left) 50 µm; (A and B, right) 20 µm; (F, right) 10 µm. (G) Quantification of intravital in vivo dendrite numbers per alveolar DC for PBS- and OVA-challenged lungs. (H) Mean squared displacements as a function of time for AMs from in vivo lungs corrected for breathing artifacts with type II epithelial cells versus sectioned lungs. (C–E, G, and H) Error bars represent SEM. Images are representative images from >12 mice per group for slice and 4 mice per group for live imaging. Quantification of dendrites, surface area, and track speed means are combined data from three separate experiments.
Figure 5.
Figure 5.
DCs directly phagocytose inhaled antigens and accumulate model antigen in airway-adjacent regions. (A) Scheme for allergen challenge includes three i.p. injections of OVA/alum and three i.n. instillations of OVA (black arrows) followed by an i.n. instillation of beads (red arrow). (B) Stills of a video from a c-fms–EGFP, Actin-CFP mouse 1 h after i.n. instillation with 1-µm fluorescent polystyrene beads. Note extension, uptake, retraction, and reextension of the indicated DC. Also note the round AM to the left of the DC, within the alveolus. Dotted lines trace the dendrite surface. (C) Migration of CD11c-EYFP cells just below the surface of an airway of an OVA-treated lung stained with Hoechst (blue) 24 h after bead inhalation. (D) Representative image of airway (AW)-associated, antigen-bearing DCs in PBS- and OVA allergen–challenged mice. Arrows indicate DCs with beads. Bars: (B and C, left) 50 µm; (B, right) 10 µm; (C, right) 20 µm; (D) 100 µm. (E) Quantification of proportion of alveolar and airway-associated DCs that contain beads immediately after and 48 h after bead inhalation corrected for the total number of beads inhaled. Error bars represent SEM. All images are representative of at least four mice per group from four independent experiments. Quantifications include data from four independent experiments.
Figure 6.
Figure 6.
DCs carry model antigen to airway-adjacent regions as well as LNs. (A) Scheme for allergen challenge includes three i.p. injections of OVA/alum and three i.n. instillations of OVA or PBS (black arrows), an i.n. instillation of red beads (red arrow), and an i.n. instillation of blue beads (blue arrow) to dissect uptake versus trafficking. (B) Example images of beads in CD11c-EYFP DCs. Arrows indicate example beads in DCs. Bars, 200 µm. (C) Quantification of beads in CD11c-EYFP DCs yielded the ratio of equilibrated (beads inhaled 48 h before analysis) to immediate (beads inhaled directly before analysis). The airway region is defined as 75 µm from the inner airway surface. (D) CD103, CD11b, and LN-resident (LNR) DC populations were compared by FACS after PBS or OVA challenge. (E) The phenotype of DCs carrying model antigen to the LN was analyzed by FACS 48 h after bead inhalation. (C–E) Error bars represent SEM. All data represents at least eight mice per group from at least five independent experiments.
Figure 7.
Figure 7.
Activated T cells interact with airway-adjacent DCs. (A) Interactions of T cells (red) and DCs (green) illustrated by a time course showing T cells swarming over the surface of multiple DCs but always remaining in contact with at least one. (B) OTII T cell accumulation within 75 µm of a representative airway compared with DC accumulation within the same area in an OVA-challenged mouse. (C) Percent duration of a 30-min video that OTII T cells were in contact with at least one DC in either the airway or alveolar region. (D) Track speed means for previously activated antigen-specific (OTII) or nonspecific (SMARTA) airway T cells. (C and D) Error bars represent SEM. (E) Activated antigen-specific (OTII) T cells were stained with CMTMR and Fluo-4 and transferred into OVA-challenged CD11c-EYFP mice 6 h before imaging. Percentage of maximum mean fluorescence intensity (MFI) of Fluo-4 in previously activated T cells. Gray background indicates the time that T cells are in contact with a DC. Each panel represents one cell. (F) Transferred T cell stained with CMTMR and Fluo-4 (gated on the CMTMR signal of the cell, pseudocolored) moves toward an airway, transiently interacting with a DC (teal) on the way. Bars: (A, left) 50 µm; (A, right) 15 µm; (F) 10 µm. Time stamps are shown in minutes/seconds. Images and quantification are representative of at least three mice per group from at least two independent experiments.

Comment in

References

    1. Aida Y., Pabst M.J. 1990. Removal of endotoxin from protein solutions by phase separation using Triton X-114. J. Immunol. Methods. 132:191–195 10.1016/0022-1759(90)90029-U - DOI - PubMed
    1. Ballesteros-Tato A., León B., Lund F.E., Randall T.D. 2010. Temporal changes in dendritic cell subsets, cross-priming and costimulation via CD70 control CD8(+) T cell responses to influenza. Nat. Immunol. 11:216–224 10.1038/ni.1838 - DOI - PMC - PubMed
    1. Belz G.T., Smith C.M., Kleinert L., Reading P., Brooks A., Shortman K., Carbone F.R., Heath W.R. 2004. Distinct migrating and nonmigrating dendritic cell populations are involved in MHC class I-restricted antigen presentation after lung infection with virus. Proc. Natl. Acad. Sci. USA. 101:8670–8675 10.1073/pnas.0402644101 - DOI - PMC - PubMed
    1. Bergner A., Sanderson M.J. 2002. Acetylcholine-induced calcium signaling and contraction of airway smooth muscle cells in lung slices. J. Gen. Physiol. 119:187–198 10.1085/jgp.119.2.187 - DOI - PMC - PubMed
    1. Bergner A., Sanderson M.J. 2003. Airway contractility and smooth muscle Ca(2+) signaling in lung slices from different mouse strains. J. Appl. Physiol. 95:1325–1332, discussion :1314 - PubMed

Publication types