. 2012 Jun;139(6):479-91.
doi: 10.1085/jgp.201210772. Epub 2012 May 14.

Glutathione/thioredoxin systems modulate mitochondrial H2O2 emission: an experimental-computational study

Affiliations

Glutathione/thioredoxin systems modulate mitochondrial H2O2 emission: an experimental-computational study

Miguel Antonio Aon et al. J Gen Physiol. 2012 Jun.

Abstract

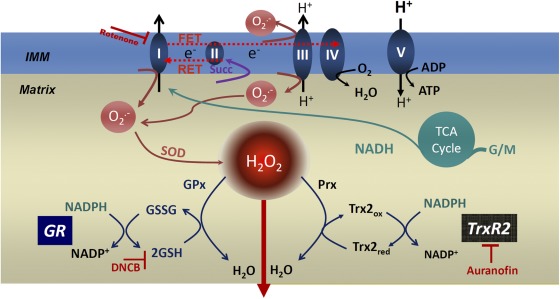
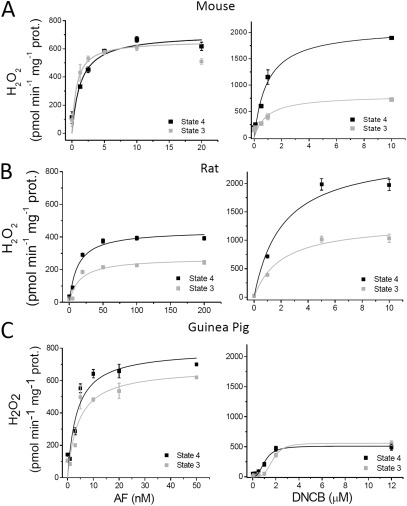
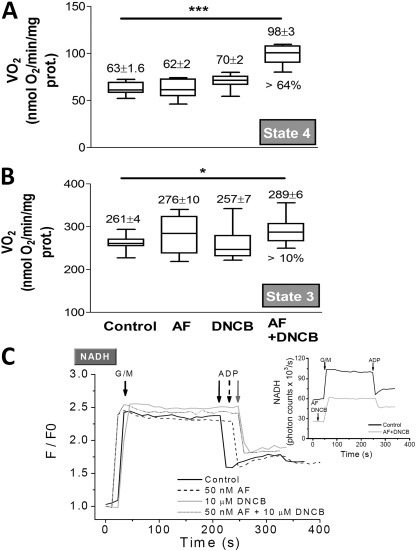
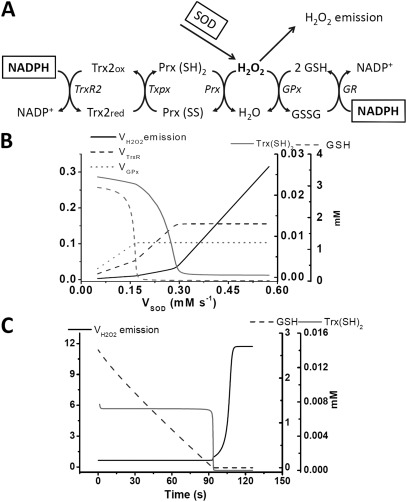
The net emission of hydrogen peroxide (H(2)O(2)) from mitochondria results from the balance between reactive oxygen species (ROS) continuously generated in the respiratory chain and ROS scavenging. The relative contribution of the two major antioxidant systems in the mitochondrial matrix, glutathione (GSH) and thioredoxin (Trx), has not been assessed. In this paper, we examine this key question via combined experimental and theoretical approaches, using isolated heart mitochondria from mouse, rat, and guinea pig. As compared with untreated control mitochondria, selective inhibition of Trx reductase with auranofin along with depletion of GSH with 2,4-dinitrochlorobenzene led to a species-dependent increase in H(2)O(2) emission flux of 17, 11, and 6 fold in state 4 and 15, 7, and 8 fold in state 3 for mouse, rat, and guinea pig mitochondria, respectively. The maximal H(2)O(2) emission as a percentage of the total O(2) consumption flux was 11%/2.3% for mouse in states 4 and 3 followed by 2%/0.25% and 0.74%/0.29% in the rat and guinea pig, respectively. A minimal computational model accounting for the kinetics of GSH/Trx systems was developed and was able to simulate increase in H(2)O(2) emission fluxes when both scavenging systems were inhibited separately or together. Model simulations suggest that GSH/Trx systems act in concert. When the scavenging capacity of either one of them saturates during H(2)O(2) overload, they relieve each other until complete saturation, when maximal ROS emission occurs. Quantitatively, these results converge on the idea that GSH/Trx scavenging systems in mitochondria are both essential for keeping minimal levels of H(2)O(2) emission, especially during state 3 respiration, when the energetic output is maximal. This suggests that the very low levels of H(2)O(2) emission observed during forward electron transport in the respiratory chain are a result of the well-orchestrated actions of the two antioxidant systems working continuously to offset ROS production.


Figures

Figure 1.
Figure 1.
Major pathways of mitochondrial ROS production and ROS scavenging. The scheme depicts the GSH and Trx systems in the mitochondrial matrix as the major H2O2 scavengers. The NADPH/NADP+ couple is the main electron donor of the large-capacity GSH (GSH and GSSG) and the Trx (Trxred and Trxox) systems responsible for scavenging H2O2 via GPx and Prx enzymes, respectively. GR and TrxR, the two reductases responsible for regenerating the reduced species of both antioxidant defenses, GSH and Trxred, are shown. The two inhibitors used in this work and their sites of action are highlighted: AF, the TrxR1/2 inhibitor, and DNCB, an alkylating GSH-depleting agent. The respiratory complexes I, II, III, IV, and V (ATP synthase) in the inner mitochondrial membrane (IMM) are also schematized. O2 can be produced by complexes I and III from the electron transport chain through reverse electron transport (RET) or FET (reverse or forward modes of electron transport), which depends on NADH- or flavin adenine dinucleotide hydrogen–linked substrates, such as G/M or succinate (Succ), donating electrons to complex I or II, respectively. O2 conversion to H2O2 by Mn SOD and the tricarboxylic acid (TCA) cycle are depicted as well. In the scheme of the computational model (see Fig. 4 A), we have split the arrow corresponding to Prx into two processes to account for the cycle of Prx oxidation/reduction as well. These processes are denoted by VPrx and Vtxpx (Eqs. 3 and 5; see Computational model formulation in Materials and methods).
Figure 2.
Figure 2.
Effect of AF or DNCB on H2O2 emission from heart mitochondria under FET at states 4 and 3 of respiration. (A–C) Freshly isolated mitochondria (∼100 µg mitochondrial protein [prot.]) from mouse, rat, and guinea pig hearts were preincubated in the absence or the presence of the indicated concentrations of AF (left graphs) or DNCB (right graphs) in the presence of the NADH-linked substrates G/M (5 mM each). Monitoring of H2O2 was performed with the Amplex red assay during states 4 (with G/M) and 3 (+1 mM ADP) of mitochondrial respiration (Stanley et al., 2011). The specific fluxes of H2O2 emission are shown. The kinetic parameters describing the fluxes of H2O2 emission as a function of the inhibitor concentration, Vmax and K0.5, were determined after nonlinear regression fitting of the experimental points with a hyperbolic Michaelis–Menten or Hill type of equation. The results ± SEM obtained from two experiments with duplicates in each are represented.
Figure 3.
Figure 3.
Respiration and redox behavior of mitochondria in the presence of AF and/or DNCB. (A and B) Freshly isolated mitochondria from guinea pig heart were handled and assayed, as described in Materials and methods. Mitochondrial respiration (VO2) was monitored under FET conditions in state 4 with G/M (A) and state 3 after addition of 1 mM ADP (B) in the absence or the presence of 50 nM AF or 10 µM DNCB or both together. The statistical significance of the differences between treatments was evaluated with ANOVA using Tukey’s multiple comparison test (*, p < 0.05; ***, p < 0.001). (C) The same mitochondrial preparation was analyzed in parallel by fluorometry for NADH and H2O2 emission (see Table 4), which were monitored simultaneously after preincubation, with the concentrations of AF and DNCB indicated. Arrows point to substrate (G/M and ADP) addition. In the whisker plots, the top and the bottom of the box represent the 75 and 25% percentile, respectively, whereas the line within the box is the median; the bars indicate the maximum and minimum values of the distribution. The numbers on top of the whisker plots correspond to the mean ± SEM (n = 12, with two experiments). prot., protein.
Figure 4.
Figure 4.
Time-dependent and steady-state behavior of the computational model of GSH/Trx systems. (A) The scheme of the computational model as described in Materials and methods. (B) The continuation analysis of the steady-state behavior as a function of the rate of H2O2 provision by SOD activity (VSOD); the latter was varied between 5 × 10⁻⁵ and 5.5 × 10⁻⁴ mM ms−1, with kTrxR1 = 0.022 ms−1 and kGR1 = 0.025 ms−1. (C) Time-dependent simulations showing the increase in the emission of H2O2 upon inhibition of kTrxR1 and kGR1, which were adjusted from 0.022 to 0.009 ms−1 and 0.025 to 0.005 ms−1, respectively, to represent the inhibitory action of AF and DNCB, respectively.
Figure 5.
Figure 5.
Model simulation of mitochondrial H2O2 emission after independent inhibition of Trx or GSH system. (A) To simulate AF inhibition with the computational model, the concentration of TrxR2 (Etrxm) was decreased from a control concentration of 0.002 to 10−8 mM. The steady-state values of H2O2 emission were estimated for each concentration at fixed GR (kcgrm = 0.0152). (B) DNCB inhibition was simulated by decreasing the concentration of GR (kcgrm) from a control value of 0.0215 mM to 10−8 mM and the steady-state values of H2O2 emission estimated at each concentration while keeping TrxR2 constant (Etrxm = 0.0035). In both cases, the percentage of inhibition was calculated by dividing the control concentration over the corresponding TrxR2 or GR concentration. The parameters used in this simulation were kcgpx = 0.013 mM, VSOD = 8 × 10⁻⁵ mM ms−1, kpxx = 2.5 mM, and Prx3T = 0.5 mM.

Similar articles

Cited by

References

    1. Adam-Vizi V., Chinopoulos C. 2006. Bioenergetics and the formation of mitochondrial reactive oxygen species. Trends Pharmacol. Sci. 27:639–645 10.1016/j.tips.2006.10.005 - DOI - PubMed
    1. Adimora N.J., Jones D.P., Kemp M.L. 2010. A model of redox kinetics implicates the thiol proteome in cellular hydrogen peroxide responses. Antioxid. Redox Signal. 13:731–743 10.1089/ars.2009.2968 - DOI - PMC - PubMed
    1. Andreyev A.Y., Kushnareva Y.E., Starkov A.A. 2005. Mitochondrial metabolism of reactive oxygen species. Biochemistry (Mosc.). 70:200–214 10.1007/s10541-005-0102-7 - DOI - PubMed
    1. Aon M.A., Cortassa S., Akar F.G., O’Rourke B. 2006. Mitochondrial criticality: A new concept at the turning point of life or death. Biochim. Biophys. Acta. 1762:232–240 - PMC - PubMed
    1. Aon M.A., Cortassa S., Maack C., O’Rourke B. 2007. Sequential opening of mitochondrial ion channels as a function of glutathione redox thiol status. J. Biol. Chem. 282:21889–21900 10.1074/jbc.M702841200 - DOI - PMC - PubMed

Publication types