. 2012 Mar;2(3):270-87.
doi: 10.1158/2159-8290.CD-11-0240. Epub 2012 Feb 24.

Suppression of tumor invasion and metastasis by concurrent inhibition of c-Met and VEGF signaling in pancreatic neuroendocrine tumors

Affiliations

Suppression of tumor invasion and metastasis by concurrent inhibition of c-Met and VEGF signaling in pancreatic neuroendocrine tumors

Barbara Sennino et al. Cancer Discov. 2012 Mar.

Abstract

Invasion and metastasis increase after the inhibition of VEGF signaling in some preclinical tumor models. In the present study we asked whether selective VEGF inhibition is sufficient to increase invasion and metastasis and whether selective c-Met inhibition is sufficient to block this effect. Treatment of pancreatic neuroendocrine tumors in RIP-Tag2 mice with a neutralizing anti-VEGF antibody reduced tumor burden but increased tumor hypoxia, hypoxia-inducible factor-1α, and c-Met activation and also increased invasion and metastasis. However, invasion and metastasis were reduced by concurrent inhibition of c-Met by PF-04217903 or PF-02341066 (crizotinib). A similar benefit was found in orthotopic Panc-1 pancreatic carcinomas treated with sunitinib plus PF-04217903 and in RIP-Tag2 tumors treated with XL184 (cabozantinib), which simultaneously blocks VEGF and c-Met signaling. These findings document that invasion and metastasis are promoted by selective inhibition of VEGF signaling and can be reduced by the concurrent inhibition of c-Met.

Significance: This report examines the mechanism of increased tumor aggressiveness after anti-VEGF therapy and presents evidence for roles of vascular pruning, hypoxia, and c-Met activation. The results show that simultaneous inhibition of c-Met and VEGF signaling not only slows tumor growth but also reduces invasion and metastasis.


Figures

Figure 1
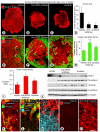
Figure 1. Inhibition of VEGF signaling: Effect on aggressiveness of RIP-Tag2 tumors
Tumors of RIP-Tag2 mice treated with vehicle, anti-VEGF antibody, or sunitinib from age 14 to 17 weeks (A-C). Composite images of tumor sections immunostained for SV40 T-antigen (red) (A-C). Differences in sectional area after anti-VEGF antibody or sunitinib (4-5 mice/group) (D). Confocal images showing tumor cells (insulin, red) and acinar cells (amylase, green) after vehicle (E), anti-VEGF antibody (F), or sunitinib (G); arrows mark islands of acinar cells surrounded by tumor cells. Area density of trapped amylase-positive cells (H) and Invasion index (I) after vehicle, anti-VEGF antibody, or sunitinib. Western blots showing differences in Snail1, N-cadherin, and vimentin protein in tumors of mice treated from age 14 to 15 weeks (J). Strong E-cadherin immunoreactivity (red) near the border (arrows) of a control tumor (K). Little E-cadherin staining in tumor cells after anti-VEGF antibody for 3 weeks (L), with confirmation of tumor-cell identity by insulin staining (M, cyan). Compared to E-cadherin, vimentin staining shows the opposite treatment-related changes (red, arrows) (N, O). *P < 0.05 vs. vehicle. #P < 0.05 vs. sunitinib. Scale bar in O applies to all images: 800 μm for A-C; 150 μm for E-G; and 30 μm for K-O.
Figure 2
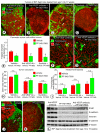
Figure 2. Inhibition of VEGF signaling: Effect on tumor vascularity, hypoxia, and c-Met
Comparison of blood vessels (CD31, red) and hypoxia (pimonidazole, green, arrows) in tumors of RIP-Tag2 mice treated with vehicle, anti-VEGF antibody, or sunitinib from age 14 to 17 weeks (A-C). Fractional areas of CD31 and pimonidazole after treatment (D). Western blots show little or no HIF-1α in tumors of control mice and strong bands after anti-VEGF antibody or sunitinib from age 14 to 15 weeks (E). c-Met immunoreactivity (red) in scattered tumor cells and many vessels (CD31, green, arrows) after vehicle, but in many tumor cells (arrowheads) after anti-VEGF antibody or sunitinib from age 14 to 15 weeks (F). Greater c-Met mRNA in tumors treated with anti-VEGF antibody or sunitinib from age 14 to 15 weeks (5-7 mice/group) (G). Greater total c-Met and phospho-c-Met in RIP-Tag2 tumors after anti-VEGF antibody from age 14 to 15 weeks, assessed by immunoprecipitation (H). Phospho-c-Met immunoreactivity (red) in scattered tumor cells (arrowheads) in control RIP-Tag2 tumors but in many tumor cells after anti-VEGF antibody or sunitinib from age 14 to 15 weeks (CD31, green) (I). Greater signal for phospho-c-Met in tumor cells isolated from 14-week old RIP-Tag2 mice, exposed in vitro for 4 hours to normal or low oxygen (Norm = 21% oxygen; Hypox = 1% oxygen), and assessed by immunoprecipitation (J). * P < 0.05 vs. vehicle. Scale bar in I applies to all images: 50 μm for A-C; 80 μm for F; 60 μm for I.
Figure 3
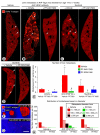
Figure 3. Inhibition of VEGF and/or c-Met: Effect on tumor invasion, vascularity, hypoxia, and cell markers
Confocal images of RIP-Tag2 tumors treated from age 14 to 17 weeks and stained for insulin (tumor cells, red) and amylase (acinar cells, green) (A-F). Trapped acinar cells marked by amylase (arrows) within tumors are numerous after anti-VEGF antibody (A) or sunitinib (C) alone but not after co-administration of PF-04217903 (B, D). Measurements of amylase staining within tumors show significant treatment-related differences (E). Similarity of vascularity (CD31, red) and hypoxic regions (pimonidazole, green, arrows) in tumors of 17-week old RIP-Tag2 mice after treatment with anti-VEGF antibody (F) or anti-VEGF antibody plus PF-04217903 (G) for 3 weeks. Bar graph showing that addition of PF-04217903 to anti-VEGF therapy did not significantly change vascularity (H) or hypoxic regions (I) in tumors. Differences in number of trapped amylase cells (arrows) after vehicle (J) or PF-04217903 alone (K). Western blot showing differences in mesenchymal markers after anti-VEGF antibody, PF-04217903, or the combination from age 14 to 15 weeks (L). * P < 0.05 vs. vehicle. # P < 0.05 vs. anti-VEGF antibody alone. = P < 0.05 vs. sunitinib alone. Scale bar in K applies to all images: 150 μm for A-D, J-K; 50 μm for F-G.
Figure 4
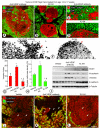
Figure 4. Inhibition of VEGF and/or c-Met: Effect on number and size of liver metastases
Contrasting number and size of metastases (arrows) in sections of liver (SV40 T-antigen, red) from RIP-Tag2 mice treated with vehicle (A), anti-VEGF antibody alone or combined with PF-04217903 (B), sunitinib alone or combined with PF-04217903 (C), or sunitinib alone or combined with PF-02341066 (D) from age 14 to 17 weeks. Treatment-related differences in number of liver metastases per square millimeter of section, with and without co-administration of PF-04217903 or PF-02341066 (E) (4-7 mice/group). * P < 0.05 vs. vehicle alone. # P < 0.05 vs. anti-VEGF antibody alone. = P < 0.05 vs. sunitinib alone. Confocal micrographs comparing the size of liver metastases in mice treated with anti-VEGF antibody alone (F) or combined with PF-04217903 (G). Fewer and smaller metastases in mice treated with PF-04217903 alone or in combination with anti-VEGF antibody or sunitinib shown by sorting all metastases in each treatment group into the three size bins shown in legend (H). Scale bar in G applies to all images: 350 μm for A-C, 450 μm for D, 100 μm for F, G.
Figure 5
Figure 5. Inhibition of VEGF and/or c-Met: Effect on Panc-1 tumor growth, c-Met, and invasion
Changes in luciferin bioluminescence during the course of 3-week treatment (A). Measurements of bioluminescence showed slower growth of tumors in mice treated with sunitinib alone or in combination with PF-04217903 (B). Irregular edges (arrows) of an untreated Panc-1 tumor section stained with hematoxylin and eosin (H&E) (C). Blood vessels (CD31, red) and hypoxic regions (pimonidazole, green, arrows) in Panc-1 tumors treated with vehicle (D), sunitinib (E) or sunitinib plus PF-04217903 (F) for 3 weeks. Bar graphs showing treatment-related differences in tumor vascularity (CD31) (G) and intratumoral hypoxia (pimonidazole) (H). c-Met immunoreactivity (red) was faint in tumor cells (arrowhead) and blood vessels (arrow) (CD31, green) in vehicle-treated Panc-1 tumors (I) but was stronger in tumor cells (arrowheads) and vessels (arrows) after sunitinib for 3 weeks (J). Trapped acinar cells marked by amylase immunoreactivity (green, arrows) in Panc-1 tumors (luciferase, red) after vehicle (K), sunitinib alone (L), or sunitinib plus PF-04217903 (M). Measurements of intratumoral acinar cells (N). * P < 0.05 vs. vehicle. = P < 0.05 vs. sunitinib plus vehicle. Scale bar in M applies to all images: 30 μm for C; 50 μm for D-F; 70 μm for I-J; 150 μm for K-M.
Figure 6
Figure 6. XL184 effects on RIP-Tag2 tumor invasion and epithelial/mesenchymal markers
Tumors from RIP-Tag2 mice treated for 3 weeks, from age 14 to 17 weeks, with anti-VEGF antibody (A) or XL184 (B). Confocal microscopic images showing tumor cells (insulin, red) and acinar cells (amylase, green) after anti-VEGF antibody (A) or XL184 (B); arrows mark islands of acinar cells surrounded by tumor cells (A). Scattered tumor cells infiltrate the exocrine pancreas after anti-VEGF antibody (C) but not XL184 (D). Irregular tumor-cell shape after anti-VEGF antibody compared to rounded shape after XL184 (E, F, arrows). Contrasting effects of vehicle, anti-VEGF antibody, and XL184 on Invasion index (G) and trapped-amylase cells after treatment from age 14 to 17 weeks (H). Western blot showing mesenchymal markers in tumors after the three treatments from age 14 to 15 weeks (I). Contrasting levels of E-cadherin immunoreactivity (red, arrows) in tumors after the three treatments from age 14 to 17 weeks (J-L). * P < 0.05 vs. vehicle; # P < 0.05 vs. anti-VEGF antibody; 4-5 mice/group. Scale bar in L applies to all images: 150 μm for A-B; 25 μm for C-D; 60 μm for E-F; 45 μm for J-L.
Figure 7
Figure 7. XL184 effects on liver metastasis and overall survival of older RIP-Tag2 mice
Metastases (arrows) in liver sections (SV40 T-antigen, red) from RIP-Tag2 mice treated with vehicle (A), anti-VEGF antibody (B), or XL184 (C) from age 14 to 17 weeks. The number of metastases after anti-VEGF antibody was 5-fold the number after vehicle, but none were detected after XL184 (D). Survival of mice after treatment beginning at age 14 weeks with vehicle (blue line, median survival = 14.7 weeks, n = 12), PF-04217903 (pink line, median survival = 16.1 weeks, n = 8), anti-VEGF antibody (green line, median survival = 16.4 weeks, n = 7), anti-VEGF antibody plus PF-04217903 (orange line, median survival = 17.3 weeks, n = 6), or XL184 (red line, 100% survival at 20 weeks, n = 6, P < 0.05 vs. vehicle and anti-VEGF antibody) (E). (One of 7 mice in the XL184 group that died from a gavage injury at 3.5 weeks was excluded.) * P < 0.05 vs. vehicle; # P < 0.05 vs. anti-VEGF antibody. Scale bar in C applies to all images: 700 μm for A-C.

Comment in

Similar articles

Cited by

References

    1. Ferrara N, Kerbel RS. Angiogenesis as a therapeutic target. Nature. 2005;438:967–74. - PubMed
    1. Ellis LM, Hicklin DJ. VEGF-targeted therapy: mechanisms of anti-tumour activity. Nat Rev Cancer. 2008;8:579–91. - PubMed
    1. Rubenstein JL, Kim J, Ozawa T, Zhang M, Westphal M, Deen DF, et al. Anti-VEGF antibody treatment of glioblastoma prolongs survival but results in increased vascular cooption. Neoplasia. 2000;2:306–14. - PMC - PubMed
    1. Casanovas O, Hicklin DJ, Bergers G, Hanahan D. Drug resistance by evasion of antiangiogenic targeting of VEGF signaling in late-stage pancreatic islet tumors. Cancer Cell. 2005;8:299–309. - PubMed
    1. Ebos JM, Lee CR, Cruz-Munoz W, Bjarnason GA, Christensen JG, Kerbel RS. Accelerated metastasis after short-term treatment with a potent inhibitor of tumor angiogenesis. Cancer Cell. 2009;15:232–9. - PMC - PubMed

Publication types

MeSH terms