. 2012 May 29;109(22):8564-9.
doi: 10.1073/pnas.1013267109. Epub 2012 May 14.

Superresolution imaging of HIV in infected cells with FlAsH-PALM

Affiliations

Superresolution imaging of HIV in infected cells with FlAsH-PALM

Mickaël Lelek et al. Proc Natl Acad Sci U S A. .

Abstract

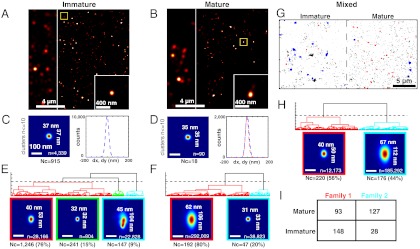
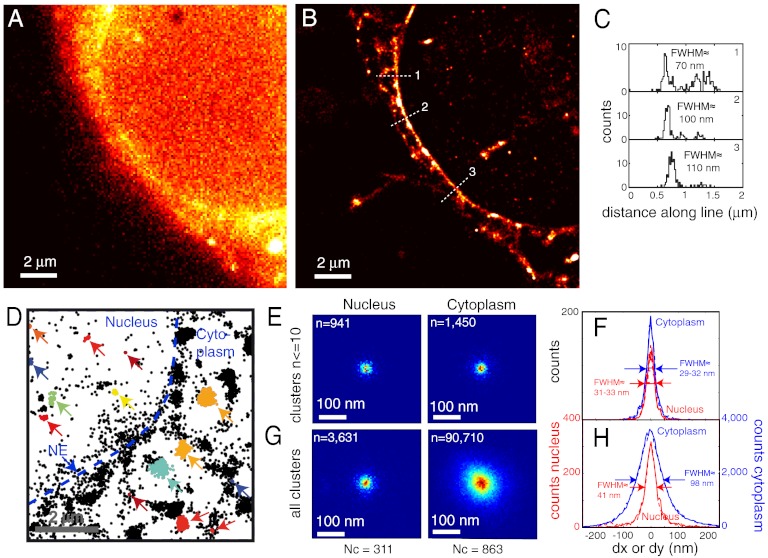
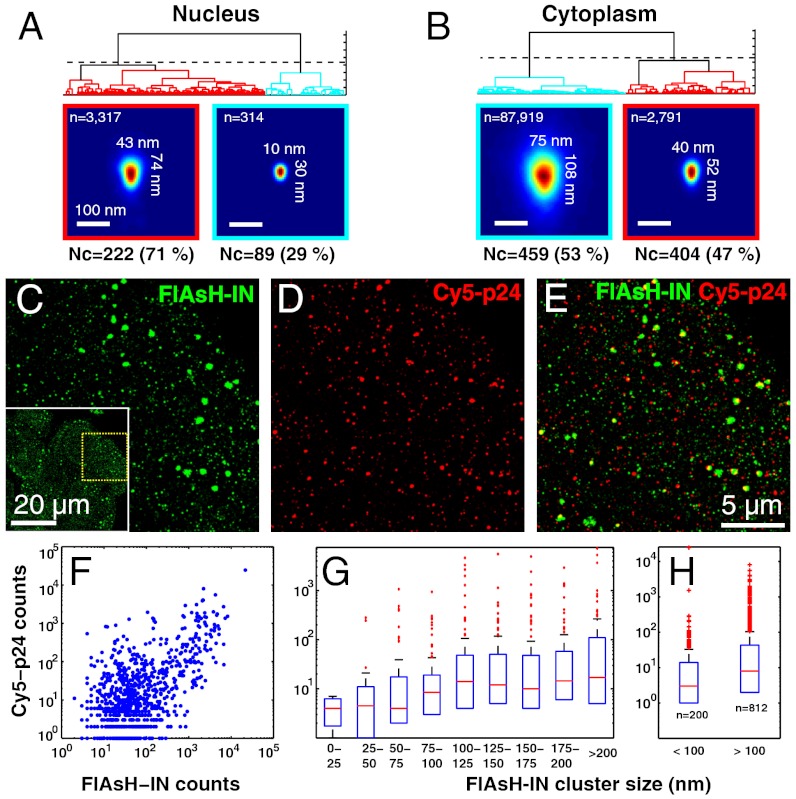
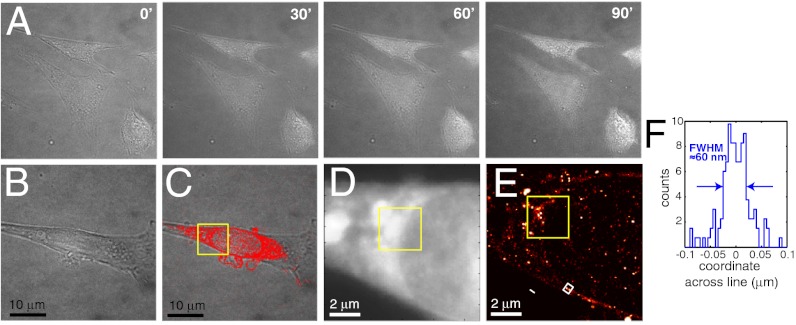
Imaging protein assemblies at molecular resolution without affecting biological function is a long-standing goal. The diffraction-limited resolution of conventional light microscopy (∼200-300 nm) has been overcome by recent superresolution (SR) methods including techniques based on accurate localization of molecules exhibiting stochastic fluorescence; however, SR methods still suffer important restrictions inherent to the protein labeling strategies. Antibody labels are encumbered by variable specificity, limited commercial availability and affinity, and are mostly restricted to fixed cells. Fluorescent protein fusions, though compatible with live cell imaging, substantially increase protein size and can interfere with their biological activity. We demonstrate SR imaging of proteins tagged with small tetracysteine motifs and the fluorescein arsenical helix binder (FlAsH-PALM). We applied FlAsH-PALM to image the integrase enzyme (IN) of HIV in fixed and living cells under experimental conditions that fully preserved HIV infectivity. The obtained resolution (∼30 nm) allowed us to characterize the distribution of IN within virions and intracellular complexes and to distinguish different HIV structural populations based on their morphology. We could thus discriminate ∼100 nm long mature conical cores from immature Gag shells and observe that in infected cells cytoplasmic (but not nuclear) IN complexes display a morphology similar to the conical capsid. Together with the presence of capsid proteins, our data suggest that cytoplasmic IN is largely present in intact capsids and that these can be found deep within the cytoplasm. FlAsH-PALM opens the door to in vivo SR studies of microbial complexes within host cells and may help achieve truly molecular resolution.


Conflict of interest statement

The authors declare no conflict of interest.

Figures

Fig. 1.
Fig. 1.
FlAsH-PALM imaging of immature and mature HIV-1 virions reveals their distinct subdiffraction shapes. (A, C, E) Immature virions obtained by treating producer cells with ritonavir. (B, D, F) Mature virions. (A, B) FlAsH-PALM images of IN in free virions; the stripe on the left shows a reconstructed widefield image for comparison. The bottom right inset is a zoomed view of the yellow-boxed area. (C, D) Resolution estimates from superposed position clusters containing ≤ 10 positions. 2D histograms (left) and 1D histograms (right) of position coordinates x and y relative to cluster mass centers; 2D histograms are visualized as heat maps from dark blue (low probability) to red (high probability); indicated sizes are FWHM measured along x and y; Nc is the number of clusters; n is the total number of positions from all clusters. (E, F, H) Morphological families. Dendrograms show the hierarchical clustering of aligned clusters based on similarity of their probability densities; dashed horizontal lines show the threshold used to define families. 2D histograms below the dendrograms show the distribution of positions in superposed aligned clusters for each family (frame color matches corresponding subtree in the dendrogram). n and Nc as above, with the percentage of clusters indicated in brackets. (GI) Discriminating mature from immature virions in a mixed population. Dendrogram and 2D histogram in (H) were obtained by analyzing a merged FlAsH-PALM image containing immature and mature virions, a portion of which is shown in (G). (I) Confusion matrix indicating how many clusters from the mature or immature virion images were assigned to each family (Families 1 and 2 correspond to the red and blue families in (G), respectively). All scale bars are 100 nm except where indicated otherwise.
Fig. 2.
Fig. 2.
FlAsH-PALM imaging of infectious HIV-1 IN in fixed cells. (A) Widefield image. (B) Superresolution reconstruction of the same area computed from 159,229 positions in 20,000 frames. (C) Histograms of spot positions projected along three line segments crossing the NE [dotted segments in (B); positions were taken from 300 nm wide rectangles centered on these segments]. The approximate FWHM is indicated. (D) FlAsH-IN clusters. Detected positions in this area are shown as small black stars; positions in automatically defined clusters are shown by colored stars and indicated by arrows. (EG) Resolution and IN complex size in the nucleus vs. cytoplasm. (E, H) 2D histograms of superposed clusters in the nucleus (left) and cytoplasm (right). (F, H) Histograms of position coordinates relative to the cluster mass center (solid lines: x, dashed lines: y, red: nucleus, blue: cytoplasm). (E, F) Clusters containing 10 or fewer detected positions for estimate of resolution. (G, H) Superposition of all clusters, irrespective of detection counts.
Fig. 3.
Fig. 3.
Optical evidence for intact HIV capsids in the cytoplasm. (AB) Morphology families of nuclear (A) and cytoplasmic (B) FLASH-IN clusters. The majority family of cytoplasmic clusters exhibits a conical probability density similar to the intact HIV capsid in contrast to the much smaller structure in the nucleus. (CH) Dual-color experiments show association of capsid protein p24 with large IN clusters. (C) FlAsH-PALM image of IN. The region shown corresponds to the yellow dotted box of the entire field of view shown in the inset (saturated to better show cell boundaries). (D) STORM image of p24 labeled with antibodies coupled to Cy5. (E) Merged image indicating partial colocalization of FlAsH-IN with p24-Cy5. (FH) Quantitative analysis of 1,012 automatically detected FlAsH-IN clusters. Number of Cy5-p24 positions in 500 nm circles enclosing FlAsH-IN position clusters plotted vs. the number of FlAsH-IN positions in these circles (F) or vs. the size (G, H) of FlAsH-IN clusters. Boxplots indicate the median (red bar) and 25% and 75% percentiles (blue bars); whiskers show the data range except for outliers (red crosses). The size of FlAsH-IN clusters is measured by FWHM = 2.35√(σxσy), where σx and σy are the standard deviations of FlAsH-IN coordinates x and y.
Fig. 4.
Fig. 4.
Live cell FlAsH-PALM on HIV-infected 3T3 cells. (A) Time-lapse brightfield images of cells exposed to the photoswitching buffer and FlAsH-PALM irradiation at 488 nm. The cells maintain normal morphology during the entire experiment, or 90 minutes. (B) Brightfield image of a cell at 10 h after infection taken before FlAsH-PALM imaging. (C) Superresolution image obtained from the 25,000 first frames, superimposed on a brightfield image taken after 108 minutes of FlAsH-PALM imaging. The cell shows no signs of toxicity. (D) Summed widefield image of the boxed region in (C). (E) FlAsH-PALM image of the same region obtained from the first 25,000 frames. (F) Histogram of positions across the NE computed from the white rectangle in (E).

References

    1. Knipe DM, Howley PM. Fundamental Virology. Philadelphia: Lippincott Williams and Wilkins; 2001.
    1. Hell SW. Microscopy and its focal switch. Nat Methods. 2009;6:24–32. - PubMed
    1. Betzig E, et al. Imaging intracellular fluorescent proteins at nanometer resolution. Science. 2006;313:1642–1645. - PubMed
    1. Rust MJ, Bates M, Zhuang X. Sub-diffraction-limit imaging by stochastic optical reconstruction microscopy (STORM) Nat Methods. 2006;3:793–795. - PMC - PubMed
    1. Fölling J, et al. Fluorescence nanoscopy by ground-state depletion and single-molecule return. Nat Methods. 2008;5:943–945. - PubMed

Publication types

MeSH terms