. 2012 Jun 26;109(26):E1743-52.
doi: 10.1073/pnas.1203689109. Epub 2012 May 14.

Mass spectral molecular networking of living microbial colonies

Affiliations

Mass spectral molecular networking of living microbial colonies

Jeramie Watrous et al. Proc Natl Acad Sci U S A. .

Abstract

Integrating the governing chemistry with the genomics and phenotypes of microbial colonies has been a "holy grail" in microbiology. This work describes a highly sensitive, broadly applicable, and cost-effective approach that allows metabolic profiling of live microbial colonies directly from a Petri dish without any sample preparation. Nanospray desorption electrospray ionization mass spectrometry (MS), combined with alignment of MS data and molecular networking, enabled monitoring of metabolite production from live microbial colonies from diverse bacterial genera, including Bacillus subtilis, Streptomyces coelicolor, Mycobacterium smegmatis, and Pseudomonas aeruginosa. This work demonstrates that, by using these tools to visualize small molecular changes within bacterial interactions, insights can be gained into bacterial developmental processes as a result of the improved organization of MS/MS data. To validate this experimental platform, metabolic profiling was performed on Pseudomonas sp. SH-C52, which protects sugar beet plants from infections by specific soil-borne fungi [R. Mendes et al. (2011) Science 332:1097-1100]. The antifungal effect of strain SH-C52 was attributed to thanamycin, a predicted lipopeptide encoded by a nonribosomal peptide synthetase gene cluster. Our technology, in combination with our recently developed peptidogenomics strategy, enabled the detection and partial characterization of thanamycin and showed that it is a monochlorinated lipopeptide that belongs to the syringomycin family of antifungal agents. In conclusion, the platform presented here provides a significant advancement in our ability to understand the spatiotemporal dynamics of metabolite production in live microbial colonies and communities.


Conflict of interest statement

The authors declare no conflict of interest.

Figures

Fig. 1.
Fig. 1.
An overview of nanoDESI analysis of microbial colonies from a Petri dish. (A) A schematic overview of nanoDESI. HV, high voltage; SS, stainless steel. (B) A photograph of the nanoDESI setup with a microbial colony grown on an agar surface in a Petri dish. (C) A mass spectrum obtained from a B. subtilis 3610 colony with nanoDESI. Asterisks mark agar sugar signals, “I” is diglycosyl diglyceride, “II” is lysyl-phosphatidylglycerol, “III” is surfactin, “IV” is sublancin (3+), “V” is sporulation killing factor (2+), “VI” is plipastatin, and “VII” is subtilosin (2+). (D) Time-dependent analysis at a single location within a 3-d-old B. subtilis 3610 colony to indicate the changes in signal intensity of specific molecules over time. DGDG, diglycosyl diglyceride; LPG, lysyl-phosphatidylglycerol; SKF, sporulation killing factor. Solvent used was methanol:acetonitrile:toluene (50:35:15). Movie S1 shows how nanoDESI works in real time.
Fig. 2.
Fig. 2.
The generation of molecular networks via spectral alignment. (A) A schematic representation of how the molecular networks are generated. The values are representative of cosine scores from 0 to 1, where 1 indicates identical spectra and 0 means no similarity whatsoever. In our data, we found that a cosine cutoff of 0.5 resulted in molecular networks that could be interpreted. The thickness of the edges (blue lines connecting nodes) indicates the level of similarity. (B) A Cytoscape visualization of the surfactin single adduct cluster from B. subtilis 3610. The full MS/MS network is shown in Fig. 3A. Nodes with red border are represented in C. (C) An example of four spectra from the molecular network shown in B that show a strong cosine score.
Fig. 3.
Fig. 3.
Molecular networks of nanoDESI fragmentation data obtained from single microbial colonies. (A) The annotated molecular network from B. subtilis 3610. (B) The annotated molecular network of S. coelicolor A3(2), M. smegmatis MC2, P. aeruginosa PAO1, and S. marcescens ES129. Insets: Images of samples were probed with nanoDESI. The structures of each of the annotated clusters are shown in SI Appendix, Figs. S1, S4, and S5. The color scale shows the mass range of the parent ions: green nodes represent the smallest masses; red nodes represent the largest masses fragmented. (Scale bar: 1 mm.)
Fig. 4.
Fig. 4.
NanoDESI and molecular networking in a time-dependent manner. (A) NanoDESI analysis over time of a single microbial colony of B. subtilis 3610. (B) An optical photograph of a 72-h colony that was probed eight times and the effect nanoDESI has on the colony phenotype. “I” is the sample (arrow points to one of sampling locations) and “II” is the control that was not subjected to nanoDESI analysis. (C) The molecular network and annotation of specific clusters from tandem MS/MS data taken from B. subtilis 3610 over time. (Scale bar: 1 mm.)
Fig. 5.
Fig. 5.
The molecular network of S. coelicolor A3(2) interacting with B. subtilis PY79. (A) The comparison of the molecular data from the S. coelicolor colony adjacent to B. subtilis vs. the S. coelicolor colony further away. (B) The comparison of the molecular data from the interacting and noninteracting sides of the B. subtilis PY79 colony. It should be noted that, although PY79 has a frame shift in sfp, the phosphopantetheinyl transferase required for surfactin and plipastatin biosynthesis, surfactin is still produced in small amounts (41). This has been observed before by MALDI imaging, as well as imprint desorption electrospray ionization, and can be attributed to promiscuity of another phosphopantetheinyl transferase or a ribosome slippage providing a low amount of in-frame translation of the frame-shifted sfp gene (19, 23).
Fig. 6.
Fig. 6.
Partial characterization of thanamycin from live colony analysis: molecular networking and peptidogenomics of Pseudomonas sp. strain SH-C52. (A) Comparative molecular network of WT strain SH-C52 and two mutants, disrupted in thaB or thaC2. Red indicates only found in WT, green indicates only found in the thaC2 mutant, and purple indicates only found in the thaB mutant. (B) Overlay of the MS spectra of all three strains with the same colors as in A. (C) MS/MS spectrum of the 2+ thanamycin ion and annotated sequence tag for thanamycin. Signals with asterisks are the chlorination isotopic signature, and signals with a number sign do not display this feature. (D) MS/MS/MS confirmation of the thanamycin signal and its sequence tag. (E) Comparison of the syringomycin gene cluster to the thanamycin gene cluster and the corresponding “best” predictions of the adenylation domain specificity according to the Stachelhaus rules (45, 46). The domains described are as follows: T, thiolation domain; A, adenylation domain; Cl, halogenase; TE, thioesterase domain. (F) Comparison of the structure of syringomycin and the partial sequence obtained for thanamycin that is consistent with the observed tandem MS data.
Fig. P1.
Fig. P1.
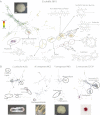
General workflow for the analysis of live colonies by nanoDESI, followed by global mass spectral data visualization by using Cytoscape, allowing for more efficient data mining and compound identification. First, the colonies grown on agar surfaces are subjected to atmospheric MS analysis. Each molecule detected by MS is then fragmented, and a similarity matrix is applied to find related spectra. Related spectra are then visualized as a network, which, in turn, facilitated compound identification.

Comment in

References

    1. Davies J. How to discover new antibiotics: harvesting the parvome. Curr Opin Chem Biol. 2011;15:5–10. - PubMed
    1. Romero D, Traxler MF, López D, Kolter R. Antibiotics as signal molecules. Chem Rev. 2011;111:5492–5505. - PMC - PubMed
    1. Phelan VV, Liu WT, Pogliano K, Dorrestein PC. Microbial metabolic exchange—the chemotype-to-phenotype link. Nat Chem Biol. 2012;8:26–35. - PMC - PubMed
    1. Davies J, Ryan KS. Introducing the parvome: Bioactive compounds in the microbial world. ACS Chem Biol. 2011;7:252–259. - PubMed
    1. Ratcliff WC, Denison RF. Microbiology. Alternative actions for antibiotics. Science. 2011;332:547–548. - PubMed

Publication types

MeSH terms