. 2012 Jul;32(14):2809-22.
doi: 10.1128/MCB.00310-12. Epub 2012 May 14.

Regulatory effects of programmed cell death 4 (PDCD4) protein in interferon (IFN)-stimulated gene expression and generation of type I IFN responses

Affiliations

Regulatory effects of programmed cell death 4 (PDCD4) protein in interferon (IFN)-stimulated gene expression and generation of type I IFN responses

Barbara Kroczynska et al. Mol Cell Biol. 2012 Jul.

Erratum in

  • Mol Cell Biol. 2012 Sep;32(17):3608

Abstract

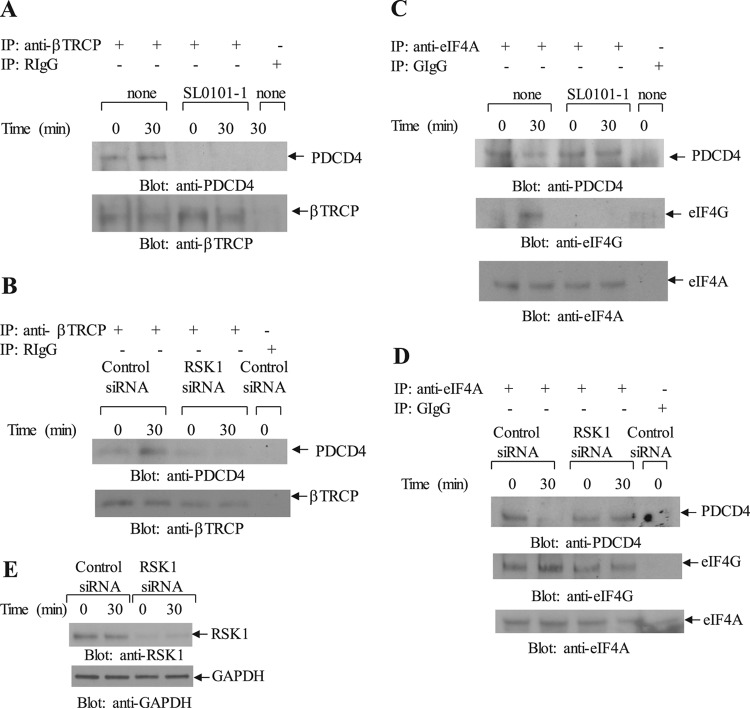
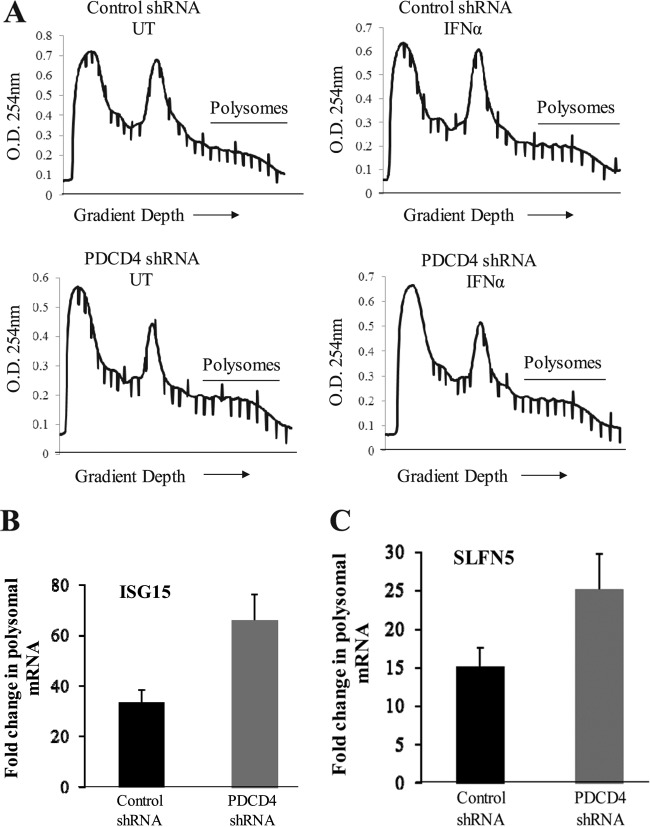
The precise mechanisms by which the activation of interferon (IFN) receptors (IFNRs) ultimately controls mRNA translation of specific target genes to induce IFN-dependent biological responses remain ill defined. We provide evidence that IFN-α induces phosphorylation of programmed cell death 4 (PDCD4) protein on Ser67. This IFN-α-dependent phosphorylation is mediated by either the p70 S6 kinase (S6K) or the p90 ribosomal protein S6K (RSK) in a cell-type-specific manner. IFN-dependent phosphorylation of PDCD4 results in downregulation of PDCD4 protein levels as the phosphorylated form of PDCD4 interacts with the ubiquitin ligase β-TRCP (β-transducin repeat-containing protein) and undergoes degradation. This process facilitates IFN-induced eukaryotic translation initiation factor 4A (eIF4A) activity and binding to translation initiation factor eIF4G to promote mRNA translation. Our data establish that PDCD4 degradation ultimately facilitates expression of several ISG protein products that play important roles in the generation of IFN responses, including IFN-stimulated gene 15 (ISG15), p21(WAF1/CIP1), and Schlafen 5 (SLFN5). Moreover, engagement of the RSK/PDCD4 pathway by the type I IFNR is required for the suppressive effects of IFN-α on normal CD34(+) hematopoietic precursors and for antileukemic effects in vitro. Altogether, these findings provide evidence for a unique function of PDCD4 in the type I IFN system and indicate a key regulatory role for this protein in mRNA translation of ISGs and control of IFN responses.


Figures

Fig 1
Fig 1
Effects of IFN-α on phosphorylation and degradation of PDCD4 in MEFs. (A) Serum-starved S6K1+/+ S6K2+/+ (WT) and S6K1−/− S6K2−/− MEFs were treated with IFN-α for the indicated times. Total cell lysates were resolved by SDS-PAGE and immunoblotted with antibodies against the phosphorylated form of PDCD4 on Ser67 or against PDCD4 as indicated (top panel). Signals were quantified by densitometry and used to calculate the intensity of phosphorylated PDCD4 relative to that of total PDCD4 (bottom panel). Data are expressed as ratios of phospho-PDCD4 to PDCD4 for each experimental condition and represent means ± standard error of the results of three experiments, including the one shown in the upper panel. (B) Serum-starved wild-type MEFs were pretreated for 60 min with rapamycin or U0126 and were subsequently treated with IFN-α for the indicated times. Cell lysates were resolved by SDS-PAGE and immunoblotted with anti-phospho-Ser67-PDCD4, anti-PDCD4, anti-phospho-Thr202/Tyr204-ERK1/2 or anti-ERK1/2 antibodies, as indicated. (C) Serum-starved S6K1+/+ S6K2+/+ (WT) or S6K1−/− S6K2−/− MEFs were incubated with IFN-α for 6 h, as indicated. Total cell lysates were resolved by SDS-PAGE and immunoblotted with antibodies against PDCD4 or against GAPDH, as indicated. (D) Serum-starved WT MEFs were pretreated for 60 min with rapamycin or U0126 and were subsequently treated with IFN-α in the continuous presence or absence of rapamycin or U0126 for 6 h as indicated. The cells were lysed, and total cell lysates were resolved by SDS-PAGE and immunoblotted with antibodies against PDCD4 or against GAPDH, as indicated. (E) Serum-starved S6K1+/+ S6K2+/+ MEFs were treated with IFN-α for the indicated times in the presence or absence of the proteasome inhibitor MG132. Total cell lysates were resolved by SDS-PAGE and immunoblotted with anti-PDCD4 or anti-GAPDH antibodies, as indicated.
Fig 2
Fig 2
IFN-dependent regulation of PDCD4 phosphorylation and protein expression in KT1 hematopoietic cells. (A) Serum-starved KT1 cells were pretreated for 60 min with rapamycin or the MEK inhibitor U0126 and were subsequently treated with IFN-α in the continuous presence or absence of rapamycin or U0126 for the indicated times. Cell lysates were resolved by SDS-PAGE and immunoblotted with anti-phospho-Ser67-PDCD4, anti-PDCD4, anti-phospho-Thr202/Tyr204-ERK1/2, anti-ERK1/2, anti-phospho-S6K, and anti-S6K antibodies as indicated. (B) Similar experiment as shown in panel A, except that cells were pretreated for 60 min with rapamycin or for 180 min with SL0101-1. Total cell lysates were resolved by SDS-PAGE and immunoblotted witFh anti-phospho-Ser67-PDCD4, anti-phospho-Ser221-RSK1, anti-RSK1, and anti-S6K, as indicated. Equal cell lysates from the same experiment were analyzed separately by SDS-PAGE and immunoblotted with anti-PDCD4, anti-phospho-Thr421/Ser424-S6K, anti-phospho-Ser240/244-rpS6, and anti-rpS6. (C) The upper panel shows an experiment similar to that in panel B, except that the cells were treated for 6 h as indicated. Protein lysates were analyzed by immunoblotting with antibodies against PDCD4 or against GAPDH. Signals were quantified by densitometry and used to calculate the intensity of expression of PDCD4 relative to that of GAPDH (lower panel). Data are expressed as ratios of PDCD4 to GAPDH for each experimental condition and represent means ± standard error of the results of three experiments, including the experiment shown in the upper panel. (D) Serum-starved U266 cells were pretreated for 60 min with rapamycin or for 3 h with SL0101-1 and were subsequently treated with IFN-α in the continuous presence or absence of rapamycin or SL0101-1, as indicated. Cell lysates were resolved by SDS-PAGE and immunoblotted with anti-phospho-Ser67-PDCD4, anti-PDCD4, anti-phospho-Ser240/244-rpS6, or anti-rpS6, as indicated. (E) Serum-starved U266 cells were pretreated for 60 min with rapamycin or for 3 h with SL0101-1, as indicated, and were subsequently treated with IFN-α in the continuous presence or absence of the indicated inhibitors for 6 h. Cell lysates were resolved by SDS-PAGE and immunoblotted with anti-PDCD4 or anti-GAPDH antibodies, as indicated.
Fig 3
Fig 3
RSK1 activity mediates IFN-α-dependent PDCD4 phosphorylation in hematopoietic cells. (A) KT1 cells were transfected with either control siRNA or siRNAs specifically targeting RSK1 and after serum starvation were treated with IFN-α, as indicated. Total cell lysates were resolved by SDS-PAGE and immunoblotted with anti-RSK1, anti-phospho-Ser67-PDCD4, anti-PDCD4, or anti-GAPDH antibodies, as indicated. (B) Serum-starved KT1 cells were pretreated with SL0101-1 for 3 h and then treated with IFN-α for the indicated times. The cells were lysed, and equal amounts of protein were immunoprecipitated (IP) with an anti-RSK1 antibody. In vitro kinase assays to detect RSK1 activity were subsequently carried out on the immunoprecipitates, using PDCD4 protein as an exogenous substrate.
Fig 4
Fig 4
IFN-α-inducible Ser67 PDCD4 phosphorylation results in its interaction with β-TRCP. (A) Serum-starved KT1 cells were pretreated for 3 h with SL0101-1 and were left untreated or treated with IFN-α in the continuous presence or absence of SL0101-1, as indicated. Equal amounts of cell lysates were immunoprecipitated with an anti-β-TRCP antibody or control nonimmune rabbit IgG (RIgG). Immune complexes were resolved by SDS-PAGE for analysis of PDCD4 and β-TRCP, as indicated. (B) KT1 cells were transfected with either control siRNA or RSK1 siRNA and after serum starvation were either left untreated or treated with IFN-α for 30 min as indicated. Equal amounts of cell lysates were immunoprecipitated with an anti-β-TRCP antibody or control RIgG. Immune complexes were resolved by SDS-PAGE for analysis of PDCD4 and β-TRCP, as indicated. (C) The experiment is similar to that shown in panel A, except that equal amounts of cell lysates were immunoprecipitated with an anti-eIF4A antibody or control nonimmune goat IgG (GIgG). Immune complexes were resolved by SDS-PAGE for analysis of PDCD4, eIF4G, and eIF4A, as indicated. (D) The experiment is similar to that shown in panel B, except that equal amounts of cell lysates were immunoprecipitated with an anti-eIF4A antibody or control GIgG. Immune complexes were resolved by SDS-PAGE for analysis of PDCD4, eIF4G, and eIF4A, as indicated. (E) Lysates for the different experimental conditions from the experiment shown in panel D were resolved by SDS-PAGE and immunoblotted by anti-RSK1 or anti-GAPDH antibodies to establish RSK1 knockdown in cells transfected with siRNA against RSK1.
Fig 5
Fig 5
Regulation of type I IFN-inducible binding of eIF4G and eIF4A to the 7-methylguanosine cap complex by PDCD4. (A) Serum-starved KT1 cells were pretreated for 60 min with rapamycin or for 3 h with SL0101-1 and were subsequently treated with IFN-α in the continuous presence or absence of SL0101-1 for the indicated times. Total cell lysates were bound to the cap analog m7GTP conjugated to beads, and bound proteins were resolved by SDS-PAGE and immunoblotted with the indicated antibodies. The lysates used were the same from the experiment shown in Fig. 2C. (B) KT1 cells were transfected with either control siRNA or RSK1 siRNA and after serum starvation were either left untreated or treated with IFN-α for 6 h as indicated. Total cell lysates were resolved by SDS-PAGE and immunoblotted with the indicated antibodies. (C) Cell lysates from the experiment shown in panel B were bound to the cap analog m7GTP conjugated to beads, and after extensive washing, bound proteins were resolved by SDS-PAGE and immunoblotted with the indicated antibodies. (D) KT1 cells were transfected with either control siRNA or PDCD4 siRNA and after serum starvation were either left untreated or treated with IFN-α for 6 h, as indicated. Total cell lysates were resolved by SDS-PAGE and immunoblotted with the indicated antibodies. (E) Cell lysates from the experiment shown in panel D were bound to the cap analog m7GTP conjugated to beads, and after extensive washing, bound proteins were resolved by SDS-PAGE and immunoblotted with the indicated antibodies. For the anti-eIF4G blot, two different exposures of the same blot (a shorter and a longer exposure) are shown in the upper two panels. (F) KT1 cells were transfected with HA-tagged PDCD4 WT, the PDCD4(S67/71A) mutant, or empty vector, as indicated, serum starved, and treated with IFN-α as indicated. Total cell lysates were resolved by SDS-PAGE and immunoblotted with the indicated antibodies (upper panel). Signals were quantified by densitometry and used to calculate the intensity of expression of HA-PDCD4 relative to that of GAPDH (lower panel). Data are expressed as ratios of HA-PDCD4 to GAPDH for each experimental condition and represent means ± standard error of the results of three experiments, including the one shown in the upper panel. (G) Cell lysates from the experiment shown in panel F were bound to the cap analog m7GTP conjugated to beads, and after extensive washing, bound proteins were resolved by SDS-PAGE and immunoblotted with the indicated antibodies. (H) The experiment shown in the upper panel is similar to that shown in panel A, except that equal amounts of cell lysates were immunoprecipitated with an anti-eIF4E antibody or control mouse IgG1 (mIgG1). Immune complexes were resolved by SDS-PAGE for analysis of eIF4G, eIF4A, and eIF4E as indicated. The signals were quantified by densitometry and used to calculate the intensity of binding of eIF4G and eIF4A to eIF4E (lower panel). Data are expressed as ratios of eIF4G or eIF4A to eIF4E for each experimental condition and represent means ± standard error of the results of three experiments, including the one shown in the upper panel. (I) The experiment is similar to that shown in panel C, except that equal amounts of cell lysates were immunoprecipitated with an anti-eIF4E antibody. Immune complexes were resolved by SDS-PAGE for analysis of eIF4G, eIF4A, and eIF4E, as indicated. (J) The experiment is similar to that shown in panel E, except that equal amounts of cell lysates were immunoprecipitated with an anti-eIF4E antibody or control mIgG1. Immune complexes were resolved by SDS-PAGE for analysis of eIF4G, eIF4A, 4E-BP1, and eIF4E, as indicated. (K) The experiment is similar to that shown in panel G, except that equal amounts of cell lysates were immunoprecipitated with an anti-eIF4E antibody or control mIgG1. Immune complexes were resolved by SDS-PAGE for analysis of eIF4G, eIF4A, and eIF4E, as indicated.
Fig 5
Fig 5
Regulation of type I IFN-inducible binding of eIF4G and eIF4A to the 7-methylguanosine cap complex by PDCD4. (A) Serum-starved KT1 cells were pretreated for 60 min with rapamycin or for 3 h with SL0101-1 and were subsequently treated with IFN-α in the continuous presence or absence of SL0101-1 for the indicated times. Total cell lysates were bound to the cap analog m7GTP conjugated to beads, and bound proteins were resolved by SDS-PAGE and immunoblotted with the indicated antibodies. The lysates used were the same from the experiment shown in Fig. 2C. (B) KT1 cells were transfected with either control siRNA or RSK1 siRNA and after serum starvation were either left untreated or treated with IFN-α for 6 h as indicated. Total cell lysates were resolved by SDS-PAGE and immunoblotted with the indicated antibodies. (C) Cell lysates from the experiment shown in panel B were bound to the cap analog m7GTP conjugated to beads, and after extensive washing, bound proteins were resolved by SDS-PAGE and immunoblotted with the indicated antibodies. (D) KT1 cells were transfected with either control siRNA or PDCD4 siRNA and after serum starvation were either left untreated or treated with IFN-α for 6 h, as indicated. Total cell lysates were resolved by SDS-PAGE and immunoblotted with the indicated antibodies. (E) Cell lysates from the experiment shown in panel D were bound to the cap analog m7GTP conjugated to beads, and after extensive washing, bound proteins were resolved by SDS-PAGE and immunoblotted with the indicated antibodies. For the anti-eIF4G blot, two different exposures of the same blot (a shorter and a longer exposure) are shown in the upper two panels. (F) KT1 cells were transfected with HA-tagged PDCD4 WT, the PDCD4(S67/71A) mutant, or empty vector, as indicated, serum starved, and treated with IFN-α as indicated. Total cell lysates were resolved by SDS-PAGE and immunoblotted with the indicated antibodies (upper panel). Signals were quantified by densitometry and used to calculate the intensity of expression of HA-PDCD4 relative to that of GAPDH (lower panel). Data are expressed as ratios of HA-PDCD4 to GAPDH for each experimental condition and represent means ± standard error of the results of three experiments, including the one shown in the upper panel. (G) Cell lysates from the experiment shown in panel F were bound to the cap analog m7GTP conjugated to beads, and after extensive washing, bound proteins were resolved by SDS-PAGE and immunoblotted with the indicated antibodies. (H) The experiment shown in the upper panel is similar to that shown in panel A, except that equal amounts of cell lysates were immunoprecipitated with an anti-eIF4E antibody or control mouse IgG1 (mIgG1). Immune complexes were resolved by SDS-PAGE for analysis of eIF4G, eIF4A, and eIF4E as indicated. The signals were quantified by densitometry and used to calculate the intensity of binding of eIF4G and eIF4A to eIF4E (lower panel). Data are expressed as ratios of eIF4G or eIF4A to eIF4E for each experimental condition and represent means ± standard error of the results of three experiments, including the one shown in the upper panel. (I) The experiment is similar to that shown in panel C, except that equal amounts of cell lysates were immunoprecipitated with an anti-eIF4E antibody. Immune complexes were resolved by SDS-PAGE for analysis of eIF4G, eIF4A, and eIF4E, as indicated. (J) The experiment is similar to that shown in panel E, except that equal amounts of cell lysates were immunoprecipitated with an anti-eIF4E antibody or control mIgG1. Immune complexes were resolved by SDS-PAGE for analysis of eIF4G, eIF4A, 4E-BP1, and eIF4E, as indicated. (K) The experiment is similar to that shown in panel G, except that equal amounts of cell lysates were immunoprecipitated with an anti-eIF4E antibody or control mIgG1. Immune complexes were resolved by SDS-PAGE for analysis of eIF4G, eIF4A, and eIF4E, as indicated.
Fig 6
Fig 6
Effects of RSK1-mediated phosphorylation and degradation of PDCD4 on IFN-α dependent expression of ISG protein products. (A) Serum-starved KT1 cells were either left untreated or were treated with IFN-α for the indicated times, in the presence or absence of MG132 or diluent for MG132 (dimethyl sulfoxide). Cell lysates were resolved by SDS-PAGE and immunoblotted with anti-PDCD4, -p21WAF1/CIP1, -ISG15, -SLFN5, or anti-GAPDH antibody. (B to D) Serum-starved KT1 cells were pretreated with SL0101-1 for 3 h and then treated with IFN-α for the indicated times. The cells were lysed, and equal amounts of protein were resolved by SDS-PAGE and immunoblotted with the indicated antibodies. (E to G) Serum-starved KT1 cells were treated with IFN-α for 6 h in presence or absence of SL0101-1. Expression of mRNA for Isg15 (E), p21WAF1/CIP1 (F), and slfn5 (G) genes was assessed by quantitative real-time RT-PCR. The GAPDH transcript was used for normalization. Data are expressed as fold increase over IFN-α-untreated samples and represent means ± standard error of three experiments. (H) KT1 cells were transfected with either control siRNA or siRNA specifically targeting RSK1 and after serum starvation were either left untreated or treated with IFN-α, as indicated. The cells were lysed, and equal amounts of protein were resolved by SDS-PAGE and immunoblotted with anti-RSK1, anti-PDCD4, anti-ISG15, or anti-GAPDH antibody, as indicated.
Fig 7
Fig 7
Phosphorylation of PDCD4 on Ser67 is required for expression of ISG protein products by IFN-α. (A) KT1 cells were transfected with either empty vector, HA-tagged wild-type PDCD4, or HA-tagged PDCD4(S67/71A) mutant, serum starved, and left untreated or treated with IFN-α. Total cell lysates were resolved by SDS-PAGE and immunoblotted with the indicated antibodies. (B and C) KT1 cells were transfected with either control siRNA or siRNA specifically targeting PDCD4 and after serum starvation were either left untreated or were treated with IFN-α for the indicated times. Total cell lysates were resolved by SDS-PAGE and immunoblotted with the indicated antibodies.
Fig 8
Fig 8
Regulatory effects of PDCD4 ISG mRNA translation. (A) KT1 cells transduced with control shRNA or shRNA-targeted human PDCD4 were either left untreated (UT) or treated with IFN-α for 24 h. Cell lysates were separated on 10 to 50% sucrose gradient, and the optical density (OD) at 254 nm was recorded. The OD at 254 nm is shown as a function of gradient depth for each treatment. (B and C) Polysomal fractions were collected as indicated in panel A, and RNA was isolated. Quantitative real-time RT-PCR assays to determine Isg15 (B) and slfn5 (C) mRNA expression in polysomal fractions were conducted using gapdh for normalization. Data are expressed as fold increase over IFN-α-untreated samples and represent means ± standard deviations of three independent experiments.
Fig 9
Fig 9
Regulatory effects of PDCD4 in the generation of the antileukemic effects of IFN-α. (A) KT1 cells were transfected with either control siRNA or siRNA specifically targeting PDCD4, as indicated. The cells were subsequently plated in methylcellulose, in the absence or presence of IFN-α, and leukemic CFU-L colony formation was assessed. Data are expressed as the percentage of control colony formation of untreated samples for each condition and represent means ± standard error of four experiments. (B) KT1 cells were transfected with the empty vector, PDCD4 WT, or PDCD4 S67/71A mutant, as indicated. The cells were subsequently plated in methylcellulose, in the absence or presence of IFN-α, and leukemic CFU-L colony formation was assessed. Data are expressed as the percentage of control colony formation of untreated samples for each condition and represent means ± standard error of six experiments.
Fig 10
Fig 10
Regulatory effects of RSK1 and PDCD4 in the inhibitory properties of IFN-α on normal bone marrow-derived myeloid precursors. (A) Normal CD34+ bone marrow-derived cells were transfected with either control siRNA or siRNA specifically targeting PDCD4 or siRNA specifically targeting RSK1, as indicated. The cells were subsequently plated in methylcellulose, in the absence or presence of IFN-α. CFU-GM progenitor colonies were scored after 14 days in culture. Data are expressed as percent control colony formation from untreated cells and represent means ± standard error of three independent experiments. (B) Normal CD34+ bone marrow-derived cells were transfected with either the plasmid PCDNA3, HA-tagged PDCD4 WT, or PDCD4(S67/71A) mutant and incubated in the absence or presence of IFN in clonogenic assays in methylcellulose, as indicated. CFU-GM progenitor colonies were scored after 14 days in culture. Data are expressed as percent control colony formation from untreated cells and represent means ± standard error of four independent experiments.

Similar articles

Cited by

References

    1. Bitomsky N, Wethkamp N, Marikkannu R, Klempnauer KH. 2008. siRNA-mediated knockdown of Pdcd4 expression causes up regulation of p21Waf1/Cip1 expression. Oncogene 27:4820–4829 - PubMed
    1. Bohm M, et al. 2003. The transformation suppressor protein Pdcd4 shuttles between nucleus and cytoplasm and binds RNA. Oncogene 22:4905–4910 - PubMed
    1. Carayol N, et al. 2008. Suppression of programmed cell death 4 (PDCD4) protein expression by BCR-ABL-regulated engagement of the mTOR/p70 S6 kinase pathway. J. Biol. Chem. 283:8601–8610 - PMC - PubMed
    1. Cmarik JL, et al. 1999. Differentially expressed protein Pdcd4 inhibits tumor promoter-induced neoplastic transformation. Proc. Natl. Acad. Sci. U. S. A. 96:14037–14042 - PMC - PubMed
    1. Critchley-Thorne RJ, et al. 2009. Impaired interferon signaling is a common immune defect in human cancer. Proc. Natl. Acad. Sci. U. S. A. 106:9010–9015 - PMC - PubMed

Publication types

MeSH terms

Substances