. 2012 Jul;32(14):2760-70.
doi: 10.1128/MCB.06706-11. Epub 2012 May 14.

NF-E2-related factor 1 (Nrf1) serves as a novel regulator of hepatic lipid metabolism through regulation of the Lipin1 and PGC-1β genes

Affiliations

NF-E2-related factor 1 (Nrf1) serves as a novel regulator of hepatic lipid metabolism through regulation of the Lipin1 and PGC-1β genes

Yosuke Hirotsu et al. Mol Cell Biol. 2012 Jul.

Abstract

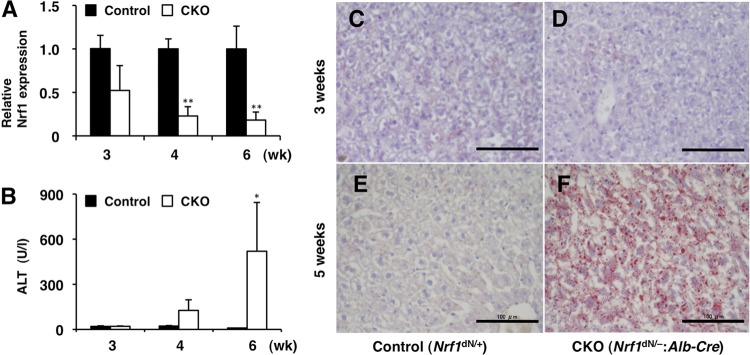
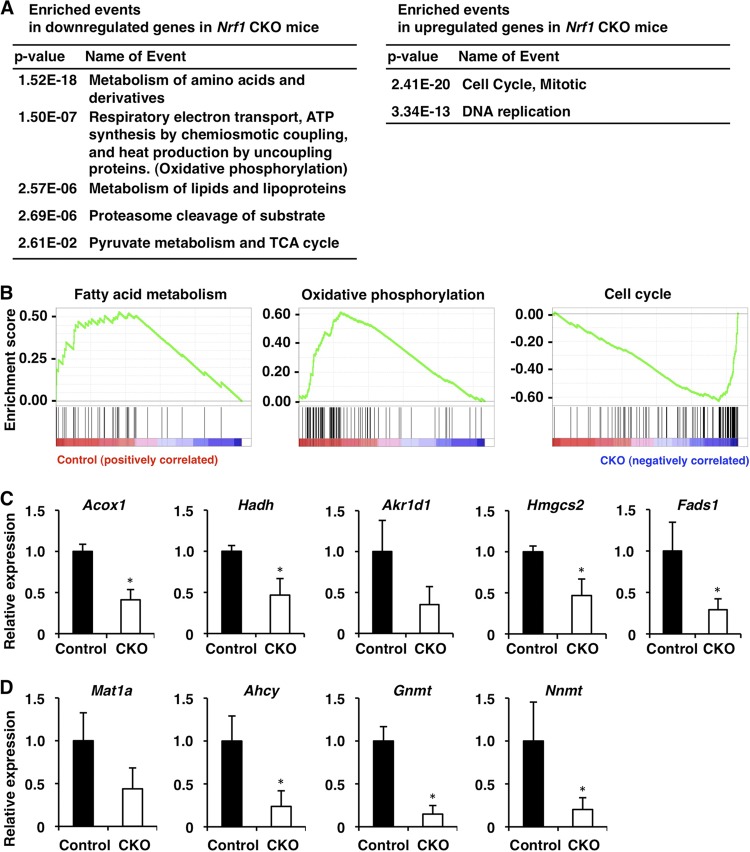
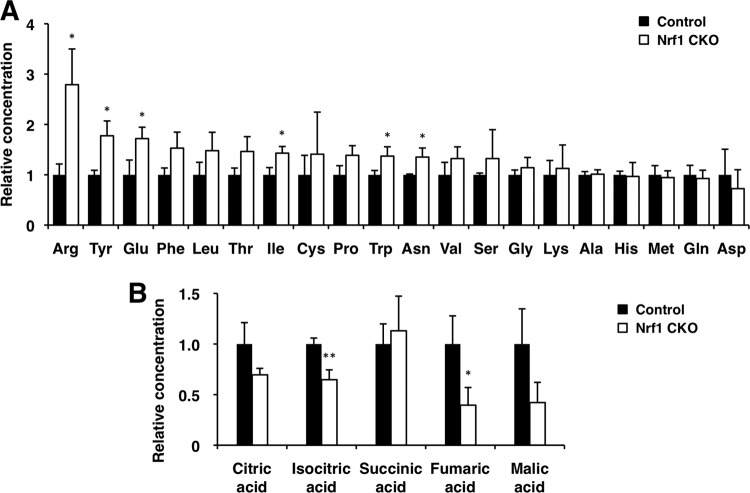
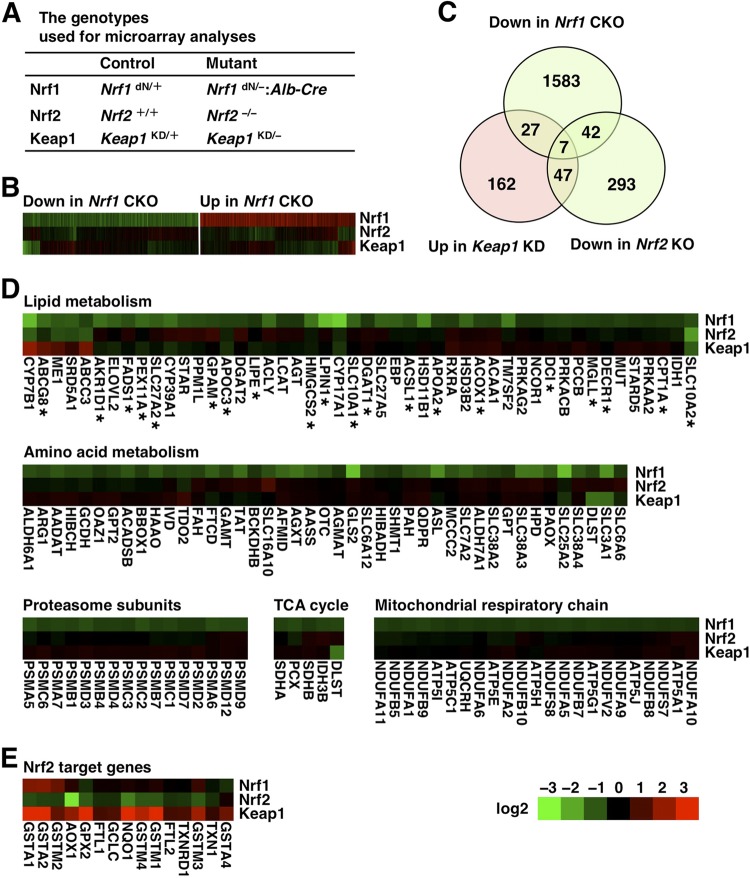
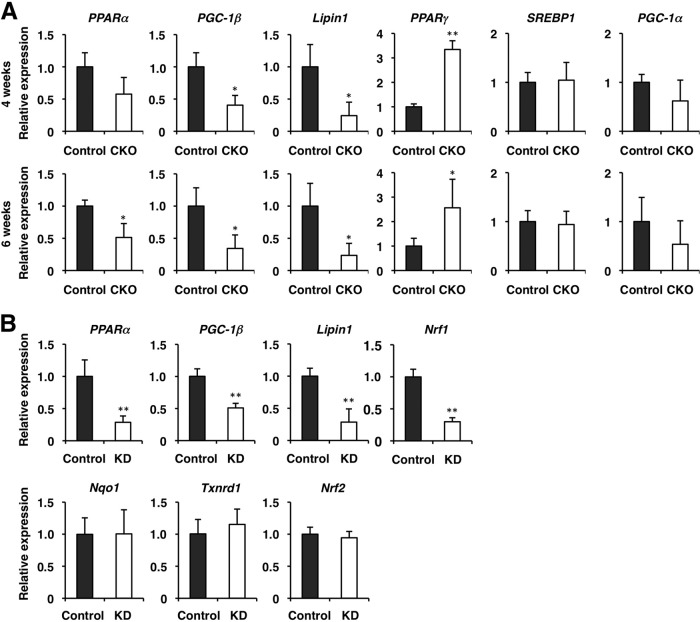
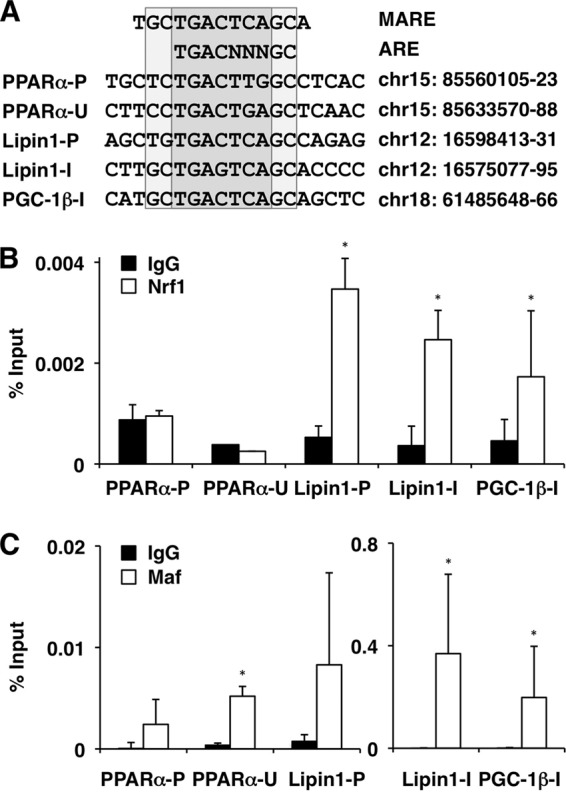
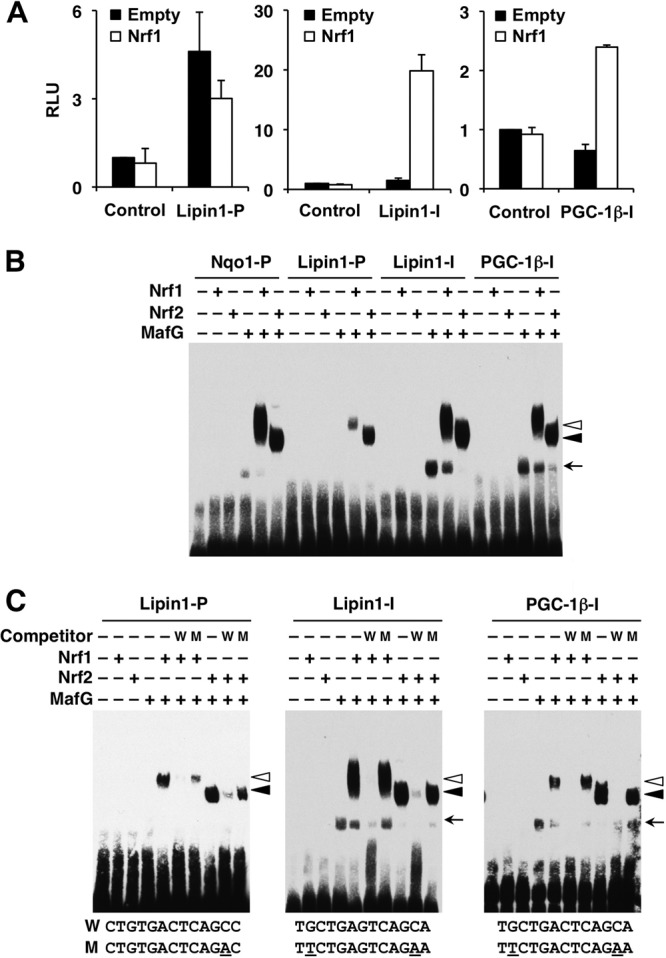
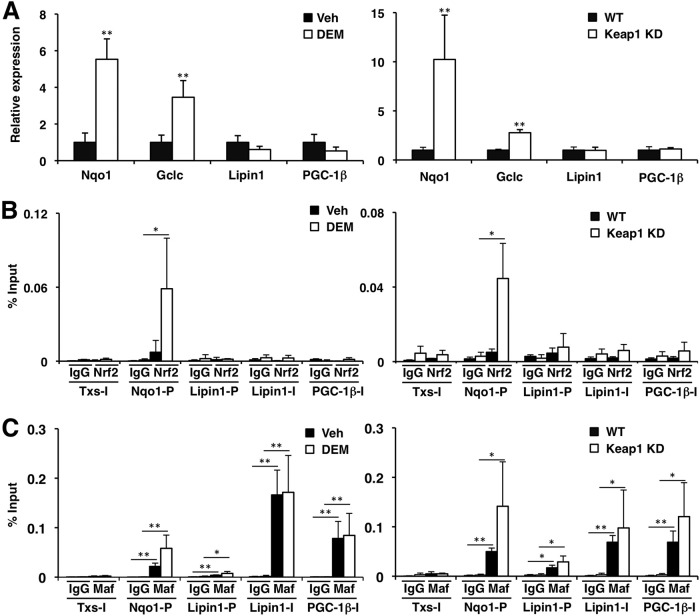
Hepatic lipid metabolism is under elaborate regulation, and perturbations in this regulatory process at the transcriptional level lead to pathological conditions. NF-E2-related factor 1 (Nrf1) is a member of the cap'n'collar (CNC) transcription factor family. Hepatocyte-specific Nrf1 gene conditional-knockout mice are known to develop hepatic steatosis, but it remains unclear how Nrf1 contributes to the lipid homeostasis. Therefore, in this study we examined the gene expression profiles of Nrf1-deficient mouse livers. A pathway analysis based on the profiling results revealed that the levels of expression of the genes related to lipid metabolism, amino acid metabolism, and mitochondrial respiratory function were decreased in Nrf1-deficient mouse livers, indicating the profound effects that the Nrf1 deficiency conferred to various metabolic pathways. We discovered that the Nrf1 deficiency leads to the reduced expression of the transcriptional coactivator genes Lipin1 and PGC-1β (for peroxisome proliferator-activated receptor γ coactivator 1β). Chromatin immunoprecipitation analyses showed that Nrf1 binds to the antioxidant response elements (AREs) in regulatory regions of the Lipin1 and PGC-1β genes and the binding of Nrf1 to the AREs activates reporter gene transcription. These results thus identified Nrf1 to be a novel regulator of the Lipin1 and PGC-1β genes, providing new insights into the Nrf1 function in hepatic lipid metabolism.


Figures

Fig 1
Fig 1
Deficiency of Nrf1 leads to impairment of hepatocellular functions. (A) Nrf1 mRNA expression in the livers from Nrf1dN/+ (control) and Nrf1dN/−:Alb-Cre (CKO) mice at 3, 4, and 6 weeks of age. Nrf1 mRNA expression was examined by qPCR. (B) Serum ALT activity in control and Nrf1-CKO mice. The data represent the mean ± SD (n = 3). P values are from Student's unpaired t test: *, P < 0.05; **, P < 0.01. (C to F) Liver sections from control and Nrf1-CKO mice at 3 weeks (C and D) and 5 weeks (E and F) of age were stained with oil red O. Bars, 100 μm.
Fig 2
Fig 2
Microarray analyses to identify the enrichment of genes associated with various metabolic pathways. (A) Table of Reactome pathways significantly enriched with genes that are downregulated or upregulated in Nrf1-CKO mouse livers. Complete lists of the downregulated and upregulated genes are shown in Table S2 in the supplemental material. (B) GSEA histograms for the gene sets involved in fatty acid metabolism, oxidative phosphorylation, and cell cycle regulation. The nominal P values of these gene sets are all less than 0.001, and the normalized enrichment scores are 1.28, 1.52, and −1.70, respectively. At the bottom of each plot, the spectrum of gene expression observed in the microarray is shown. The left side of the graphs indicates reduced expression and the right side indicates increased expression in the Nrf1-CKO mice. (C) Expression of representative PPARα target genes (Acox1, Hadh, Akr1d1, Hmgcs2, and Fads1) was examined by qPCR. (D) Expression of genes related to methionine metabolism (Mat1a, Ahcy, Gnmt, and Nnmt) was examined by qPCR. RNA samples were prepared from the livers of control and Nrf1-CKO mice at 6 weeks of age. These data represent the mean ± SD (n = 3). P values are from Student's unpaired t test: *, P < 0.05. The expression of each gene in the control mouse was set to 1.
Fig 3
Fig 3
Metabolome analyses of Nrf1-deficient liver. (A and B) Relative concentrations of amino acids (A) and TCA cycle metabolites (B) in control (Nrf1dN/dN) and Nrf1-CKO (Nrf1dN/dN:Alb-Cre) mouse livers are shown as the mean ± SD (n = 3). P values are from Student's unpaired t test: *, P < 0.05; **, P < 0.01.
Fig 4
Fig 4
Microarray analyses reveal differential gene expression profiles in the livers of Nrf1-CKO, Nrf2-knockout, and Keap1-KD mice. (A) The genotypes used for microarray analyses are shown. (B) Heat map of differentially regulated genes (≥1.5-fold change at P ≤ 0.05 [t test]) in Nrf1-CKO mice and expression data for the Nrf2-knockout and Keap1-KD mice are shown. (C) Venn diagram indicating the degree of overlap among the genes decreased in the Nrf1-CKO mice, the genes decreased in Nrf2-knockout mice, and the genes increased in Keap1-KD mice. (D and E) Heat maps of the genes that were differentially expressed in the Nrf1-CKO mice and that belong to the categories of lipid metabolism (asterisks indicate PPARα target genes), amino acid metabolism, proteasome subunits, TCA cycle, mitochondrial respiratory chain, and typical Nrf2 target genes are shown together with the expression data for the Nrf2-knockout and Keap1-KD mice. The colors of the heat map reflect the log2-fold-change values relative to the expression of each gene in the control mice. The gene symbols used here are consistent with those used in the Mouse Genome Informatics database.
Fig 5
Fig 5
Expression of transcriptional regulators associated with hepatic lipid metabolism in Nrf1-deficient livers. (A) mRNA expression was examined by qPCR in the livers of Nrf1dN/+ (control) and Nrf1dN/−:Alb-Cre (CKO) mice at 4 and 6 weeks of age. The data represent the mean ± SD (n = 3). P values are from Student's unpaired t test: *, P < 0.05; **, P < 0.01. The expression of each gene in the control mouse was set to 1. (B) Nrf1 knockdown results in the reduced expression of PPARα, Lipin1, and PGC-1β. Hepa1 cells stably expressing shRNA targeting Nrf1 (KD) or a nonsilencing control gene were used. mRNA expression in five independent clones was detected by qPCR. The data represent the mean ± SD (n = 5); **, P < 0.01. The expression of each gene in the control mouse was set to 1.
Fig 6
Fig 6
Nrf1 and MafG are recruited to the AREs of the Lipin1 and PGC-1β genes. (A) Alignment of MARE and ARE found in the regulatory regions of PPARα, Lipin1, and PGC-1β. The chromosome numbers and positions on the chromosome are indicated according to the Mouse Genome Informatics database (NCBI37/mm9). P, promoter; U, 3′ UTR; I, intron. (B and C) ChIP assays were performed with chromatin extracts from Hepa1 cells using normal IgG and anti-Nrf1 or anti-MafG antibodies and analyzed by qPCR with primers flanking the AREs in the promoter and 3′ UTR of PPARα, the promoter and intron of Lipin1, and the intron of PGC-1β. The data represent the mean ± SD (n = 3 to 6). P values are from Student's unpaired t test: *, P < 0.05.
Fig 7
Fig 7
Nrf1 binds to the AREs of the Lipin1 and PGC-1β genes and activates transcription in vitro. (A) Hepa1 cells were cotransfected with luciferase reporter constructs containing the AREs from the Lipin1 promoter, Lipin1 intron, or PGC-1β intron with or without the Nrf1 expression vector. The average values ± SD are shown (n = 3). The vertical axis indicates relative luciferase units (RLU). The normalized firefly luciferase activity in the absence of effector plasmids is set to 1. (B) EMSA analysis was performed with biotin-labeled probes containing the AREs from the Nqo1 promoter, Lipin1 promoter, Lipin1 intron, and PGC-1β intron regions. MafG and Nrf1 or Nrf2 proteins were incubated with the probes, and the protein-DNA complexes and free probes were resolved by electrophoresis. (C) MafG and Nrf1 or Nrf2 proteins were incubated in combination in the absence or presence of a 200-fold molar excess of unlabeled competitor DNA. The wild-type (W) and mutated (M) ARE or MARE sequences are shown. The mutated sequences are underlined. Open arrowheads, closed arrowheads, and arrows, Nrf1-MafG heterodimer, Nrf2-MafG heterodimer, and MafG homodimer complex, respectively.
Fig 8
Fig 8
Nrf2 does not participate in the regulation of Lipin1 and PGC-1β genes. (A) Expression of Nqo1, Gclc, Lipin1, and PGC-1β in Hepa1 cells treated with 100 μM DEM or dimethyl sulfoxide (vehicle [Veh]) for 6 h (left) or in the livers of Keap1-KD mice (right). WT, wild type. mRNA expression was analyzed by qPCR. The data represent the mean ± SD (n = 3). (B and C) ChIP analyses were performed with chromatin extracts from Hepa1 cells (left) treated with 100 μM DEM or dimethyl sulfoxide (vehicle) for 4 h or from the livers of Keap1-KD mice (right) using anti-Nrf2 (B) or anti-MafG (C) antibodies. Normal IgG was used as a negative control. The amount of immunoprecipitated DNA was analyzed by qPCR with primers flanking the ARE regions in the Nqo1 promoter, the Lipin1 promoter, and the Lipin1 and PGC-1β introns. The third intron of the thromboxane synthase (Txs) gene was used as a negative control. The data represent the mean ± SD (n = 3 to 4). P values are from Student's unpaired t test between specific antibody and IgG control: *, P < 0.05; **, P < 0.01.

References

    1. Aoyama T, et al. 1998. Altered constitutive expression of fatty acid-metabolizing enzymes in mice lacking the peroxisome proliferator-activated receptor alpha (PPARalpha). J. Biol. Chem. 273:5678–5684 - PubMed
    1. Chan J, et al. 1998. Targeted disruption of the ubiquitous CNC-bZIP transcription factor, Nrf-1, results in anemia and embryonic lethality in mice. EMBO J. 17:1779–1787 - PMC - PubMed
    1. Chowdhry S, et al. 2010. Loss of Nrf2 markedly exacerbates nonalcoholic steatohepatitis. Free Radic. Biol. Med. 48:357–371 - PubMed
    1. Cohen JC, Horton JD, Hobbs HH. 2011. Human fatty liver disease: old questions and new insights. Science 332:1519–1523 - PMC - PubMed
    1. Cullinan SB, Gordan JD, Jin J, Harper JW, Diehl JA. 2004. The Keap1-BTB protein is an adaptor that bridges Nrf2 to a Cul3-based E3 ligase: oxidative stress sensing by a Cul3-Keap1 ligase. Mol. Cell. Biol. 24:8477–8486 - PMC - PubMed

Publication types

MeSH terms

Associated data