. 2012 Aug;61(8):1935-48.
doi: 10.2337/db11-0770. Epub 2012 May 14.

Loss of Pdk1-Foxo1 signaling in myeloid cells predisposes to adipose tissue inflammation and insulin resistance

Affiliations

Loss of Pdk1-Foxo1 signaling in myeloid cells predisposes to adipose tissue inflammation and insulin resistance

Yoshinaga Kawano et al. Diabetes. 2012 Aug.

Abstract

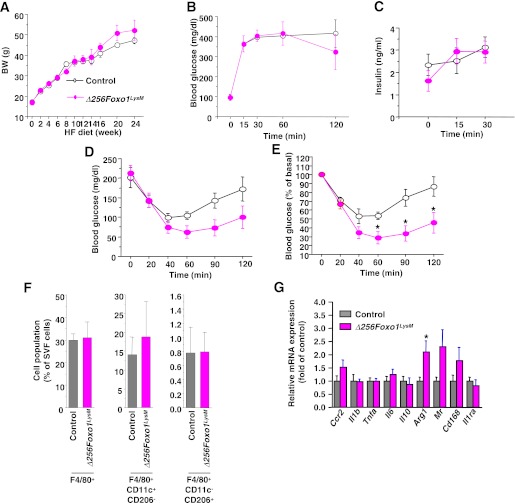
Chronic inflammation in adipose tissue contributes to obesity-related insulin resistance. The 3-phosphoinositide-dependent protein kinase 1 (Pdk1)/forkhead transcription factor (Foxo1) pathway is important in regulating glucose and energy homeostasis, but little is known about this pathway in adipose tissue macrophages (ATMs). To investigate this, we generated transgenic mice that carried macrophage/granulocyte-specific mutations, including a Pdk1 knockout (LysMPdk1(-/-)), a Pdk1 knockout with transactivation-defective Foxo1 (Δ256LysMPdk1(-/-)), a constitutively active nuclear (CN) Foxo1 (CNFoxo1(LysM)), or a transactivation-defective Foxo1 (Δ256Foxo1(LysM)). We analyzed glucose metabolism and gene expression in ATM populations isolated with fluorescence-activated cell sorting. The LysMPdk1(-/-) mice exhibited elevated M1 macrophages in adipose tissue and insulin resistance. Overexpression of transactivation-defective Foxo1 rescued these phenotypes. CNFoxo1(LysM) promoted transcription of the C-C motif chemokine receptor 2 (Ccr2) in ATMs and increased M1 macrophages in adipose tissue. On a high-fat diet, CNFoxo1(LysM) mice exhibited insulin resistance. Pdk1 deletion or Foxo1 activation in bone marrow-derived macrophages abolished insulin and interleukin-4 induction of genes involved in alternative macrophage activation. Thus, Pdk1 regulated macrophage infiltration by inhibiting Foxo1-induced Ccr2 expression. This shows that the macrophage Pdk1/Foxo1 pathway is important in regulating insulin sensitivity in vivo.


Figures

FIG. 1.
FIG. 1.
Characterization of InsR, Pdk1, and Foxo1 in ATMs during an HFD. A: The percentages of InsR+ cells among F4/80+ cells in epididymal fat from age-matched wild-type mice fed an NCD and 24 weeks of an HFD. Values are means + SEM of eight mice. *P < 0.005, **P < 0.01, and ***P < 0.05 (one-factor ANOVA). B: Representative immunofluorescence images of epididymal fat double labeled for InsR and F4/80 in wild-type mice fed an HFD for 24 weeks. Cells that exhibit high expression level of InsR protein (top); cells that exhibit low or faint expression level of InsR (bottom). Red, green, and blue indicate InsR, F4/80, and DAPI staining, respectively. C: The percentages of phospho-PDK1+ cells among F4/80+ cells in epididymal fat from age-matched wild-type mice fed an NCD and 24 weeks of an HFD. Values are means + SEM of eight mice. *P < 0.005, **P < 0.01, ***P < 0.05 (one-factor ANOVA). D: Real-time PCR analysis of Foxo family members in cell populations sorted by flow cytometric analysis of the SVF from the epididymal fats of wild-type mice fed an HFD for 16 weeks, using anti-F4/80, anti-CD11c, and anti-CD206 antibodies. The levels of each transcript were normalized to the level in M1 macrophages. Values are means + SEM of three mice. *P < 0.05 (one-factor ANOVA, M1 vs. M2 macrophages). E: The percentages of nuclear Foxo1+ cells among F4/80+ cells in the epididymal fat of age-matched wild-type mice fed an NCD and 24 weeks of an HFD. Values are means + SEM of eight mice. *P < 0.001, **P < 0.005 (one-factor ANOVA). F: Representative immunofluorescence images of epididymal fat double labeled for Foxo1 and F4/80 in wild-type mice fed an HFD for 24 weeks. Cytosolic (top) and nuclear Foxo1 (bottom). Red, green, and blue indicate Foxo1, F4/80, and DAPI staining, respectively. G: The release of H2O2 from epididymal fats from age-matched male C57BL/6J mice fed an NCD or 4–24 weeks of an HFD. Values are expressed as mean ± SEM of five mice in each condition. *P < 0.001 (one-factor ANOVA). H: Western blotting of epididymal fats from age-matched male C57BL/6J mice fed an NCD or 4–24 weeks of an HFD. After transference to nylon membrane, tissue lysates (200 μg) were blotted to the indicated antibodies. I: Quantitative analysis of JNK and MST1 phosphorylation in epididymal fats. The intensity of each band was measured using NIH Image 1.62, and the intensities of bands of phospho-JNK or phospho-MST1 bands were corrected by total JNK or MST1 and calculated as the fold change from NCD. Data are means + SEM of five mice in each genotype. *P < 0.001, **P < 0.005, and ***P < 0.05 (one-factor ANOVA of NCD vs. HFD). WAT, white adipose tissue; P, phospho; W, weeks. (A high-quality digital representation of this figure is available in the online issue.)
FIG. 2.
FIG. 2.
Effects of the deletion of Pdk1 or inhibition of the transactivation of Foxo1 on glucose metabolism and insulin sensitivity. A: Representative immunofluorescence images of epididymal fat double labeled for CD68 and PDK1 in 24-week-old wild-type and LysMPdk1−/− mice. Green, red, and blue indicate CD68, PDK1, and DAPI staining, respectively. B: Expression of Pdk1 in peritoneal macrophages and peripheral tissues. Western blot of Pdk1 and tubulin (loading control) in the white adipose tissue (WAT), liver, spleen, brown adipose tissue (BAT), lungs, heart, and kidneys of control and LysMPdk1−/− (KO) mice. C: The percentages of nuclear Foxo1+ among F4/80+ cells in epididymal fat of control, LysMPdk1−/−, and Δ256LysMPdk1−/− mice aged 20–24 weeks. Counting of cells stained with anti-F4/80 and anti-FOXO1 are described in research design and methods. Values are means + SEM of three mice in each genotype. *P < 0.005 (one-factor ANOVA). D: Body weight of control, LysMPdk1−/−, and Δ256LysMPdk1−/− fed an NCD. Data are means + SEM of 18–20 mice in each genotype. E: IPGTT of control (open circle), LysMPdk1−/− (red circle), and Δ256LysMPdk1−/− (blue circle) mice fed an NCD. Data are means + SEM of 20–25 mice in each genotype at age 20–24 weeks. *P < 0.05 (two-way repeated-measures ANOVA with an ad hoc multiple comparison method [Fisher LSD test] of LysMPdk1−/− vs. control or Δ256LysMPdk1−/− mice). F: Comparison of AUC in control, LysMPdk1−/−, and Δ256LysMPdk1−/− mice during IPGTT. Data are means + SEM of 20–25 mice in each genotype. *P < 0.01 (two-way repeated-measures ANOVA with Fisher LSD test of LysMPdk1−/− vs. Δ256LysMPdk1−/− mice) and **P < 0.05 (two-way repeated-measures ANOVA with Fisher LSD test of LysMPdk1−/− vs. control mice). G and H: Insulin secretion (G) of control (open circle), LysMPdk1−/− (red circle), and Δ256LysMPdk1−/− (blue circle) mice during IPGTT and blood glucose (H) during ITT. Data are means + SEM of 20–25 mice in each genotype. *P < 0.05 (two-way repeated-measures ANOVA with Fisher LSD test of control vs. LysMPdk1−/− or Δ256LysMPdk1−/− mice). I: Insulin-stimulated phosphorylation of IRSs and Akt in epididymal fat (WAT), liver, and skeletal muscle from control, LysMPdk1−/−, and Δ256LysMPdk1−/− mice. For Western blotting with phospho- and total Akt, the same filters, in which tissue lysates (200 μg) were transferred, were blotted with the indicated antibodies. For immunoprecipitation of IRSs, tissue lysates (10 mg) were immunoprecipitated with the indicated antibodies and blotted with anti-phosphotyrosine antibody and then reblotted with anti-IRS antibody. J: Expression of genes specific for gluconeogenesis in liver from control, LysMPdk1−/−, and Δ256LysMPdk1−/− mice in the random fed state. Values were normalized to β-actin expression and represent means + SEM of 8–10 mice in each genotype. *P < 0.05 (one-factor ANOVA of LysMPdk1−/− vs. Δ256LysMPdk1−/−). K: Hepatic glycogen content. Control (n = 9), LysMPdk1−/− (n = 9), and Δ256LysMPdk1−/− (n = 8) mice were killed in the random fed state for the determination of glycogen levels in liver extracts. Data are means + SEM of hepatic glycogen content corrected by the weight of liver per genotype. *P < 0.05 (one-factor ANOVA of control vs. LysMPdk1−/− mice). (A high-quality digital representation of this figure is available in the online issue.)
FIG. 3.
FIG. 3.
Effects of Pdk1 deletion or inhibition of the transactivation of Foxo1 on adipose tissue inflammation. A: CLSs in epididymal fats were quantified from eight different fields per mouse and presented as number of CLSs per field. Data are means + SEM of 9–10 mice in each genotype. *P < 0.01 (one-factor ANOVA of LysMPdk1−/− vs. control mice) and **P < 0.05 (one-factor ANOVA of LysMPdk1−/− vs. Δ256LysMPdk1−/− mice). B: The expression of F4/80 and CD11c and CD206 in the SVF of epididymal fat from 20- to 24-week-old mice of the indicated genotype as assessed by flow cytometry. C: The percentages of F4/80+, F4/80+CD11c+CD206, and F4/80+CD11cCD206+ cells within the viable SVF from 20- to 24-week-old mice of control, LysMPdk1−/−, and Δ256LysMPdk1−/− mice. Data are means + SEM of three mice in each genotype analyzed in three independent experiments. *P < 0.05 (one-factor ANOVA of LysMPdk1−/− vs. control or Δ256LysMPdk1−/− mice). D: Expression of genes in the epididymal fat of control, LysMPdk1−/−, and Δ256LysMPdk1−/− mice. Values were normalized to β-actin expression and represent the means + SEM of 8–10 mice per genotype. *P < 0.05 (one-factor ANOVA). E: Expression of genes specific for M1 (Ccr2, Il1b, Tnfa, and Il6) or M2 (Il10, Arg1, Mr, and Cd168) macrophage in SVF of epididymal fat in control, LysMPdk1−/−, and Δ256LysMPdk1−/− mice. Values were normalized to β-actin expression and represent the means + SEM of 8–10 mice per genotype. *P < 0.05 and **P < 0.01 (one-factor ANOVA).
FIG. 4.
FIG. 4.
Effects of the overexpression of CNFoxo1 in macrophages on glucose metabolism and adipose tissue inflammation. A: The percentages of nuclear FLAG+ among F4/80+ cells in epididymal fat of CNFoxo1LysM fed an HFD for 16 weeks. Counting of cells stained with anti-FLAG and anti-F4/80 are described in research design and methods. B: The percentages of nuclear Foxo1+ among F4/80+ cells in epididymal fat of control, CNFoxo1LysM fed an NC, and CNFoxo1LysM mice aged 20 weeks and fed an HFD for 16 weeks. Counting of cells stained with anti-F4/80 and anti-FOXO1 are described in research design and methods. Values are means + SEM of eight mice in each genotype. *P < 0.005 and **P < 0.05 (one-factor ANOVA). C: Body weight (BW) of control and CNFoxo1LysM mice fed an HFD. Data are means + SEM of 18–20 mice in each genotype. *P < 0.05 (two-way repeated-measures ANOVA with an ad hoc multiple comparison method [Fisher LSD test] of control vs. CNFoxo1LysM mice after 8 weeks of HFD). D: IPGTT of control (open circle) and CNFoxo1LysM (blue circle) mice fed an HFD. Data are means + SEM of 20–25 mice in each genotype. E: Comparison of AUC in control and CNFoxo1LysM mice during IPGTT. Data are means + SEM of 20–25 mice in each genotype. *P < 0.05 (two-way repeated-measures ANOVA with Fisher LSD test of control vs. CNFoxo1LysM mice). F: Insulin secretion of control (open circle) and CNFoxo1LysM (blue circle) mice during IPGTT. Data are means + SEM of 20–25 mice in each genotype. *P < 0.05 (two-way repeated-measures ANOVA with Fisher LSD test of control vs. CNFoxo1LysM mice). G: ITT of control (open circle) and CNFoxo1LysM (blue circle) mice. Data are means + SEM of 20–25 mice in each genotype. *P < 0.01 and **P < 0.05 (two-way repeated-measures ANOVA with Fisher LSD test of control vs. CNFoxo1LysM mice). H: CLSs in epididymal fats were quantified from eight different fields per mouse and presented as number of CLSs per field. Data are means + SEM of 9–10 mice in each genotype. *P < 0.05 (one-factor ANOVA of control vs. CNFoxo1LysM mice). I: Expression of F4/80 and CD11c and CD206 in cells of the SVF of epididymal fat from control and CNFoxo1LysM mice fed an HFD for 16 weeks as assessed by flow cytometry. J: The percentages of F4/80+, F4/80+CD11c+CD206, and F4/80+CD11cCD206+ cells within the viable SVF from control and CNFoxo1LysM 20- to 24-week-old mice fed an HFD for 16 weeks. The percentages of cell population among total SVF cells were calculated in each experiment. Data are means + SEM of fold change of control mice in each genotype (n = 3) analyzed in three independent experiments. *P < 0.05 (one-factor ANOVA of control vs. CNFoxo1LysM mice).
FIG. 5.
FIG. 5.
Foxo1 increases migration capacity by inducing Ccr2 expression. A: Expression of genes specific for M1 (Ccr2, Il1b, Tnfa, and Il6) or M2 (Il10, Arg1, Mr, and Cd168) phenotype of cells of the SVF from control and CNFoxo1LysM mice fed an HFD for 16 weeks. Values were normalized to β-actin expression and represent the means + SEM of 8–10 mice per genotype. *P < 0.05 (one-factor ANOVA of control vs. CNFoxo1LysM mice). B: Expression of Ccr2 in ATMs sorted from the SVF of epididymal fat from control and CNFoxo1LysM mice fed an HFD for 16 weeks. Values were normalized to β-actin expression and represent the means + SEM of three mice per genotype. *P < 0.05 (one-factor ANOVA of control vs. CNFoxo1LysM mice). C: Flag-CNFoxo1 protein expression was detected in RAW264.7 cells. Nontransduced RAW264.7 cells (lane 1); RAW264.7 cells transduced with adenovirus encoding CNFoxo1 at 20 and 100 MOI (lanes 2 and 3, respectively). Western blot of cell lysates using anti-tubulin antibody (bottom). D: Expression of Flag-CNFoxo1 gene in RAW264.7 cells transduced with adenoviruses encoding CNFoxo1 at the indicated MOI. E: Real-time PCR to determine Ccr2 expression in RAW264.7 cells transduced with adenovirus encoding LacZ or CNFoxO1 at the indicated MOI. The cells were transduced, incubated in complete medium, and harvested 48 h after transduction. Data (mean ± SEM) are from three independent experiments and normalized to the amount of β-actin mRNA, expressed as relative to the corresponding LacZ value. *P < 0.05 (one-factor ANOVA of cells transduced with LacZ vs. CNFoxo1 at 20 or 100 MOI). F: Expression of Flag CNFoxO1 and HA-Δ256FoxO1 at indicated MOI in RAW264.7 cells. Western blot using anti-Foxo1 (N18) antibody, which recognizes the NH2 terminus of Foxo1 (top). Arrows A and B indicate Flag-CNFoxo1 and HA-Δ256Foxo1, respectively. G: The effects of HA-Δ256Foxo1 on Flag-CNFoxo1–induced Ccr2 expression in RAW264.7 cells. Data are means + SEM from three independent experiments and are expressed as the fold change from endogenous Ccr2 expression in RAW264.7 cells transduced with an adenovirus encoding LacZ. *P < 0.005 and **P < 0.05 (one-factor ANOVA of cells transduced with LacZ vs. Flag-CNFoxo1 at MOI 100 and cells transduced with Flag-CNFoxo1 at MOI 100 vs. HA-Δ256Foxo1 at MOI 50 and 100). H: Expression of genes Ccr2, Tnfa, and Il1b of BMDM from the indicated genotypes. Cells were cultured for 6 days in the presence of PBS, insulin (100 nmol/L), or IL-4 (100 ng/mL). Values were normalized to β-actin expression and represent the means + SEM of fold of PBS in each genotype (8–10 mice per genotype). *P < 0.005 (one-factor ANOVA of PBS vs. insulin or IL-4 in control mice), **P < 0.01 (one-factor ANOVA of PBS vs. insulin in Δ256LysMPdk1−/− mice), and ***P < 0.05 (one-factor ANOVA of PBS vs. IL-4 in Δ256LysMPdk1−/− mice). I and J: Migration of BMDM from control, LysMPdk1−/−, and Δ256LysMPdk1−/− mice (I) and from control and CNFoxo1LysM mice (J) through a gelatin matrix was analyzed using a transwell migration assay at the indicated concentration of MCP-1. Data are means + SEM of cell numbers per 10 high power fields (HPFs) from three independent experiments. *P < 0.005 (one-factor ANOVA of LysMPdk1−/− vs. control or Δ256LysMPdk1−/− mice at basal condition), **P < 0.01 (one-factor ANOVA of LysMPdk1−/− vs. Δ256LysMPdk1−/− mice at 100 ng/mL of MCP-1), and ***P < 0.05 (one-factor ANOVA of LysMPdk1−/− vs. control mice and of control vs. CNFoxo1LysM mice at 100 ng/mL of MCP-1).
FIG. 6.
FIG. 6.
Ccr2 as a target gene of Foxo1 and the effects of insulin or IL-4 on genes for M2 signature. A: Effect of Foxo1 on Ccr2 promoter activity. Data were obtained from 10 experiments and are represented as means ± SEM of fold change from mock vector-transfected activity. *P < 0.001, **P < 0.005, and ***P < 0.05 (one-factor ANOVA of cells transfected with pCMV5/cMyc and pCVM5/cMyc-CNFoxo1 vector). B: EMSA of Foxo1 binding to DNA. The DNA probe was derived from a 31–base pair DNA covering the consensus Foxo1 binding site (−267/−237 nt) of the mouse Ccr2 promoter (lanes 1–3). A mutant DNA with an altered Foxo1 binding motif was used as a control (lanes 4–6). The position of the slowed complex is indicated as A, and the supershifted complex is indicated as B. C: Oligonucleotide probes corresponding to the Foxo1 binding site of the Ccr2 promoter were incubated with nuclear extracts in the absence or presence of increasing amounts of unlabeled wild-type (lanes 1–4) or mutant oligonucleotide (lanes 5–8). D: Mouse Ccr2 promoter and primer pairs used in ChIP assay. The magenta box indicates a consensus Foxo1 binding site. E: ChIP assays of RAW264.7 cells transduced with an adenovirus encoding CNFoxo1 and harvested 36 h after transduction (left). The PCR primers amplified the mouse Ccr2 promoter sequence as shown in Fig. 5G. PCR reactions with total input chromatin are shown as control. Western blotting of transduced CNFoxo1 using anti-FLAG (lane 1) and anti-Foxo1 (lane 2) antibodies (right). The position of CNFoxo1 is indicated as A, and endogenous Foxo1 is indicated as B. F: Expression of genes Arg1, Cd163, Il10, and Mr of BMDM from the indicated genotypes. Cells were cultured for 2 days in the presence of PBS (control), insulin (100 nmol/L), or IL-4 (100 ng/mL). Values were normalized to β-actin expression and represent the means + SEM of fold of PBS in each genotype (8–10 mice per genotype). *P < 0.001, **P < 0.005, ***P < 0.01, and ****P < 0.05 (one-factor ANOVA among the indicated genotypes). WT, wild-type.
FIG. 7.
FIG. 7.
A transactivation-defective (Δ256) Foxo1 partially protected against diet-induced insulin resistance. A: Body weight (BW) of control and Δ256Foxo1LysM mice fed an HFD. Data are means + SEM of 20 mice in each genotype. B: IPGTT of control (open circle) and Δ256Foxo1LysM (magenta circle) mice fed an HFD. Data are means + SEM of 20 mice in each genotype. C: Insulin secretion of control (open circle) and Δ256Foxo1LysM (magenta circle) mice during IPGTT. Data are means + SEM of 20 mice in each genotype. D and E: ITT of control (open circle) and Δ256Foxo1LysM (magenta circle) mice. Data are means + SEM of 20 mice in each genotype as absolute glucose values (D) and the percentages of basal values (E). *P < 0.05 (two-way repeated-measures ANOVA with an ad hoc multiple comparison method [Fisher’s LSD test] of control vs. Δ256Foxo1LysM mice). F: The percentages of F4/80+, F4/80+CD11c+CD206, and F4/80+CD11cCD206+ cells within the viable SVF from 20- to 24-week-old mice of control and Δ256Foxo1LysM mice. Data are means + SEM of 6 mice in each genotype analyzed in three independent experiments. G: Expression of genes in the epididymal fat of control and Δ256Foxo1LysM mice. Values were normalized to β-actin expression and represent the means + SEM of 8–10 mice per genotype. *P < 0.05 (one-factor ANOVA of control vs. Δ256Foxo1LysM mice).
FIG. 8.
FIG. 8.
Control of ATM function by Pdk1-Foxo1 pathway. Pdk1 is regulated by not only insulin but also cytokines, including IL-4, which is secreted from CD4+ T cells or regulatory T cells. Furthermore, Foxo1 is regulated by not only Pdk1 but also oxidative stress through JNK and MST1. Phosphorylation of Pdk1 gradually declined during the HFD, but oxidative stress suddenly increased at the prolonged HFD, which is consistent with the time for the increased nuclear accumulation of Foxo1 in ATMs. Foxo1 directly regulates the expression of Ccr2, which upregulates the recruitment of macrophages in adipose tissue. PI3K, phosphatidylinositol 3-kinase.

Similar articles

Cited by

References

    1. Qatanani M, Lazar MA. Mechanisms of obesity-associated insulin resistance: many choices on the menu. Genes Dev 2007;21:1443–1455 - PubMed
    1. Olefsky JM, Glass CK. Macrophages, inflammation, and insulin resistance. Annu Rev Physiol 2010;72:219–246 - PubMed
    1. Saltiel AR, Kahn CR. Insulin signalling and the regulation of glucose and lipid metabolism. Nature 2001;414:799–806 - PubMed
    1. Welham MJ, Bone H, Levings M, et al. . Insulin receptor substrate-2 is the major 170-kDa protein phosphorylated on tyrosine in response to cytokines in murine lymphohemopoietic cells. J Biol Chem 1997;272:1377–1381 - PubMed
    1. Frittitta L, Grasso G, Munguira ME, Vigneri R, Trischitta V. Insulin receptor tyrosine kinase activity is reduced in monocytes from non-obese normoglycaemic insulin-resistant subjects. Diabetologia 1993;36:1163–1167 - PubMed

Publication types

MeSH terms