. 2012 Aug;61(8):2074-83.
doi: 10.2337/db11-1437. Epub 2012 May 14.

Oxidation of fatty acids is the source of increased mitochondrial reactive oxygen species production in kidney cortical tubules in early diabetes

Affiliations

Oxidation of fatty acids is the source of increased mitochondrial reactive oxygen species production in kidney cortical tubules in early diabetes

Mariana G Rosca et al. Diabetes. 2012 Aug.

Abstract

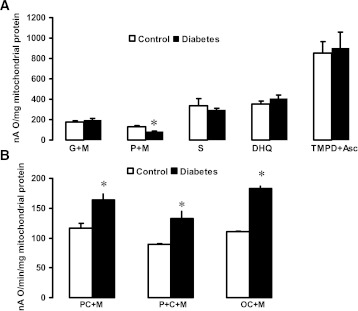
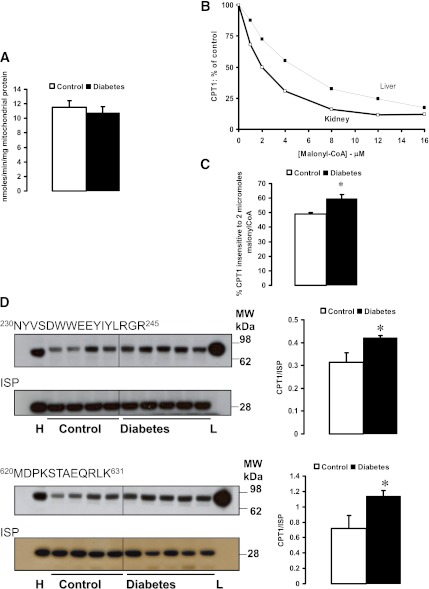
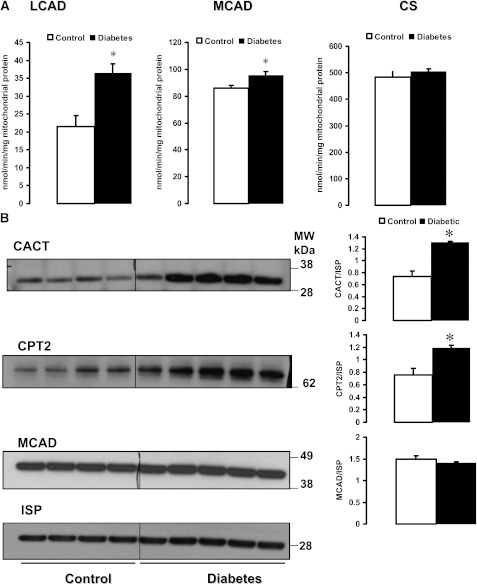
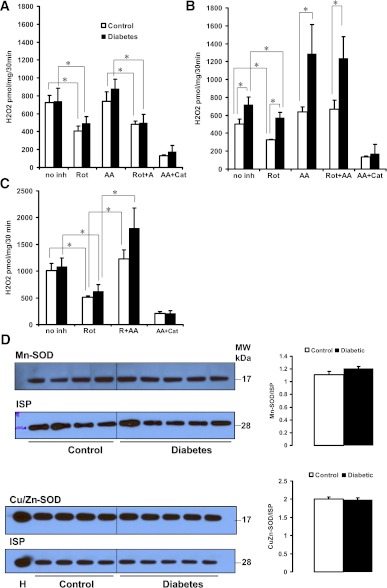
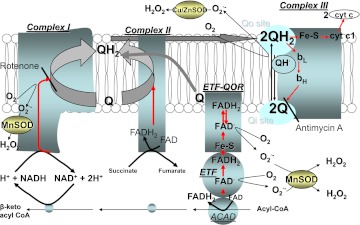
Mitochondrial reactive oxygen species (ROS) cause kidney damage in diabetes. We investigated the source and site of ROS production by kidney cortical tubule mitochondria in streptozotocin-induced type 1 diabetes in rats. In diabetic mitochondria, the increased amounts and activities of selective fatty acid oxidation enzymes is associated with increased oxidative phosphorylation and net ROS production with fatty acid substrates (by 40% and 30%, respectively), whereas pyruvate oxidation is decreased and pyruvate-supported ROS production is unchanged. Oxidation of substrates that donate electrons at specific sites in the electron transport chain (ETC) is unchanged. The increased maximal production of ROS with fatty acid oxidation is not affected by limiting the electron flow from complex I into complex III. The maximal capacity of the ubiquinol oxidation site in complex III in generating ROS does not differ between the control and diabetic mitochondria. In conclusion, the mitochondrial ETC is neither the target nor the site of ROS production in kidney tubule mitochondria in short-term diabetes. Mitochondrial fatty acid oxidation is the source of the increased net ROS production, and the site of electron leakage is located proximal to coenzyme Q at the electron transfer flavoprotein that shuttles electrons from acyl-CoA dehydrogenases to coenzyme Q.


Figures

FIG. 1.
FIG. 1.
State 3 respiratory rates of kidney cortical tubule mitochondria. A: ETC site-specific substrates. Substrates that donate the reducing equivalents to complex I (G+M, glutamate + malate; P+M, pyruvate + malate), II (S, succinate + rotenone), III (DHQ, DHQ + rotenone), and IV (TMPD+Asc, TMPD + ascorbate + rotenone) were used. B: Lipid substrates. PC+M, palmitoylcarnitine + malate; P+C+M, palmitoyl-CoA + carnitine + malate; OC+M, octanoylcarnitine + malate. State 3 was induced with 0.2 mmol/L ADP. *P < 0.05 control (n = 7) vs. diabetic (n = 6). Mean ± SEM.
FIG. 2.
FIG. 2.
CPT1 in kidney cortical tubule mitochondria. A: Specific activity of CPT1 in tubule mitochondria from control and diabetic kidneys. B: Comparison of malonyl-CoA sensitivity (IC50) of CPT1 in mitochondria from control rat liver and kidney cortical tubules. C: The percentage of CTP1 not inhibited by 2 μmol/L malonyl-CoA in tubule mitochondria from control and diabetic kidneys. D: Semiquantitative determination CPT1 protein with antibodies prepared against the amino acid sequence is shown. The bar graphs represent the densitometric quantitation of the immunoblots expressed in arbitrary units normalized per iron sulfur protein (ISP). H, heart subsarcolemmal mitochondria; L, liver mitochondrial outer membrane. *P < 0.05 control vs. diabetic. Mean ± SEM. (A high-quality color representation of this figure is available in the online issue.)
FIG. 3.
FIG. 3.
The specific activities and immunoquantitation of fatty acid β-oxidation enzymes in kidney cortical tubule mitochondria. A: Enzyme activities were measured in detergent-solubilized, frozen-thawed mitochondria from control and diabetic rats. CS, citrate synthase. B: Immunoblots and densitometric quantitation of the immunoblots are expressed in arbitrary units normalized per iron sulfur protein (ISP). *P < 0.05 control vs. diabetic. Mean ± SEM.
FIG. 4.
FIG. 4.
Kidney cortical tubule mitochondria production of H2O2 with pyruvate + malate (A) palmitoylcarnitine + malate (B), and succinate + rotenone (C) as the substrates. Rot, rotenone; AA, antimycin A; Cat, catalase. D: Semiquantitative determination of mitochondrial Mn-SOD and Cu/Zn-SOD. The bar graphs represent the densitometric quantitation of the immunoblots expressed in arbitrary units normalized per iron sulfur protein (ISP). H, heart subsarcolemmal mitochondria. *P < 0.05 compared with the indicated groups. Mean ± SEM. (A high-quality color representation of this figure is available in the online issue.)
FIG. 5.
FIG. 5.
The passage of electrons from FA to the ETC. Sites of electron leak and superoxide production and its dismutation to H2O2 are shown. The electron passage is shown in red. Electrons are released by substrate oxidation and captured by NADH and FADH2, which are oxidized by complexes I and II, respectively. These complexes pass the electrons to ubiquinone (Q). The reduced Q (ubiquinol, QH2) diffuses to and binds within the QH2 oxidation site (Qo) in complex III (formed by cytochrome b and the Fe-S protein rotated toward it). ETF linked to ETF-QOR provides an alternative pathway to pass electrons to the ETC. The FAD cofactors in ETF and ETF-QOR carry 1 electron at a time with the formation of intermediate semiquinone state of flavin. Flavin in the ETF is rapidly reduced by one electron by acyl-CoA dehydrogenases (ACAD). The slow complete reduction of flavin facilitates the accumulation of semiquinone. The electrons are donated sequentially to the Fe-S center and flavin in the ETF-QOR. Both electrons are further donated to Q (bound to the ETF-QOR in the mitochondrial inner membrane). The QH2 product leaves this site and is reoxidized in the Qo center of complex III. The transfer of electrons diverges within the Qo site: one electron is transferred to the Fe-S, followed immediately by the other electron transfer to the Qi (Q reduction site) via cytochrome bL. Under conditions of uninhibited electron flow through complex III, the reaction is rapid, preventing the accumulation of semiquinone (QH) in the Qo site. Antimycin A, a Qi site inhibitor, prevents the electron from leaving complex III, leading to accumulation of QH and O2 formation. Rotenone, an inhibitor of the Q reduction site in complex I, prevents the electrons from leaving complex I and reaching complex III, leading to an increase in O2 formation from complex I toward the matrix and decrease in O2 formation from Qo in complex III toward the intermembrane space. Superoxide is dismutated by the matrix Mn-SOD and intermembrane space Cu/Zn-SOD. (A high-quality color representation of this figure is available in the online issue.)

Similar articles

Cited by

References

    1. USRDS . USRDS: the United States Renal Data System. Am J Kidney Dis 2003;42(6 Suppl. 5):1–230 - PubMed
    1. Spencer MW, Mühlfeld AS, Segerer S, et al. . Hyperglycemia and hyperlipidemia act synergistically to induce renal disease in LDL receptor-deficient BALB mice. Am J Nephrol 2004;24:20–31 - PubMed
    1. Kambham N, Markowitz GS, Valeri AM, Lin J, D’Agati VD. Obesity-related glomerulopathy: an emerging epidemic. Kidney Int 2001;59:1498–1509 - PubMed
    1. Sun L, Halaihel N, Zhang W, Rogers T, Levi M. Role of sterol regulatory element-binding protein 1 in regulation of renal lipid metabolism and glomerulosclerosis in diabetes mellitus. J Biol Chem 2002;277:18919–18927 - PubMed
    1. Proctor G, Jiang T, Iwahashi M, Wang Z, Li J, Levi M. Regulation of renal fatty acid and cholesterol metabolism, inflammation, and fibrosis in Akita and OVE26 mice with type 1 diabetes. Diabetes 2006;55:2502–2509 - PubMed

Publication types