. 2012 Dec;7(1-4):23.
doi: 10.1007/s13758-012-0023-0. Epub 2012 Mar 3.

Regulation of integrin adhesions by varying the density of substrate-bound epidermal growth factor

Affiliations

Regulation of integrin adhesions by varying the density of substrate-bound epidermal growth factor

Tamar Shahal et al. Biointerphases. 2012 Dec.

Abstract

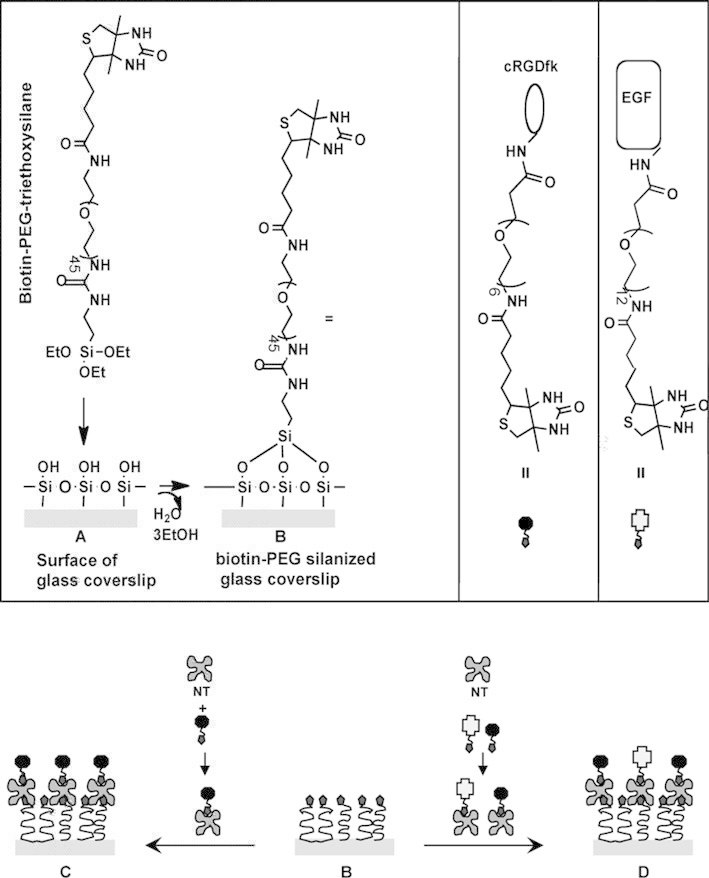
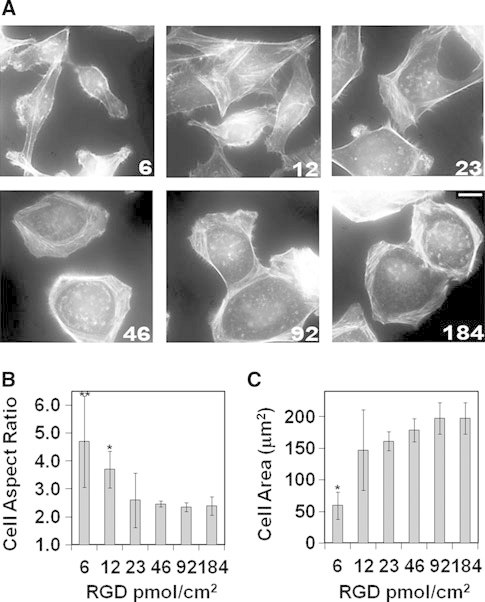
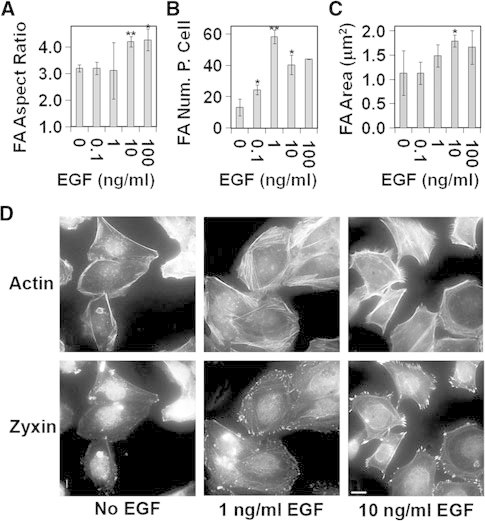
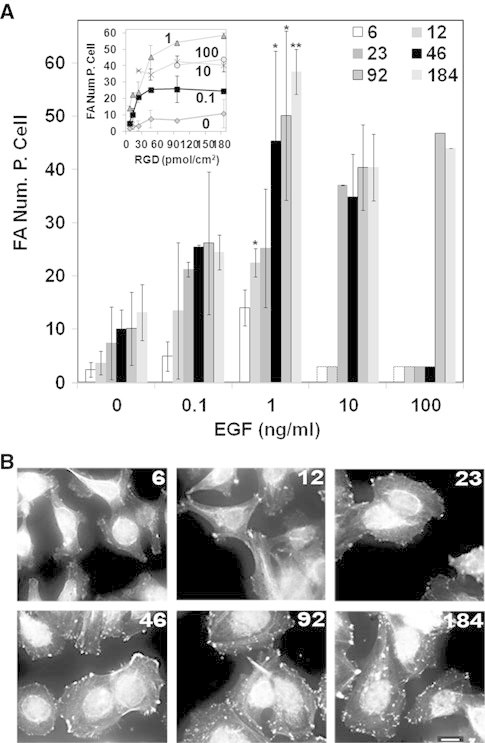
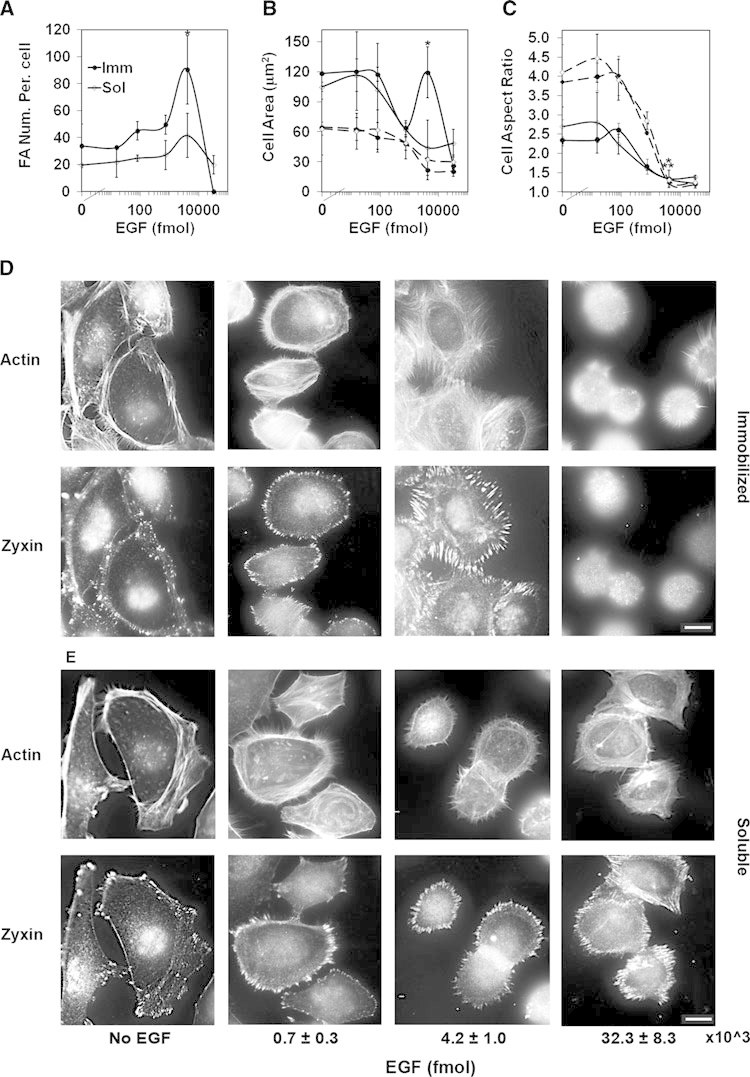
Substrates coated with specific bioactive ligands are important for tissue engineering, enabling the local presentation of extracellular stimulants at controlled positions and densities. In this study, we examined the cross-talk between integrin and epidermal growth factor (EGF) receptors following their interaction with surface-immobilized Arg-Gly-Asp (RGD) and EGF ligands, respectively. Surfaces of glass coverslips, modified with biotinylated silane-polyethylene glycol, were functionalized by either biotinylated RGD or EGF (or both) via the biotin-NeutrAvidin interaction. Fluorescent labeling of the adhering A431 epidermoid carcinoma cells for zyxin or actin indicated that EGF had a dual effect on focal adhesions (FA) and stress fibers: at low concentrations (0.1; 1 ng/ml), it stimulated their growth; whereas at higher concentrations, on surfaces with low to intermediate RGD densities, it induced their disassembly, leading to cell detachment. The EGF-dependent dissociation of FAs was, however, attenuated on higher RGD density surfaces. Simultaneous stimulation by both immobilized RGD and EGF suggest a strong synergy between integrin and EGFR signaling, in FA induction and cell spreading. A critical threshold level of EGF was required to induce significant variation in cell adhesion; beyond this critical density, the immobilized molecule had a considerably stronger effect on cell adhesion than did soluble EGF. The mechanisms underlying this synergy between the adhesion ligand and EGF are discussed.


Figures

Fig. 1
Fig. 1
A schematic presentation of RGD and EGF surface functionalization. Plasma -etched glass slides (a) are incubated with triethoxysilane–PEG–biotin in toluene, resulting in the formation of biotinylated glass slides (b). The biotinylated glass slides are further incubated with preformed NeutrAvidin (NT)–biotin–EGF/RGD complexes at various complex concentrations, resulting in the formation of glass cover slips biofunctionalized with RGD (c) or with a mixture of RGD and EGF at different densities and ratios (d)
Fig. 2
Fig. 2
A431 cell spreading on RGD-biofunctionalized surfaces at varying densities. The fluorescent images in the top panel are of actin-labeled A431 cells; the numbers on each image indicate the RGD density in pmol/cm2 (a), scale bar 15 μm. The graphs in the bottom panel display the 90th percentiles of cell aspect ratio (b) and cell area (c). All results are expressed as mean ± confidence intervals (CI). Aspect ratio and area of cells plated on 6 and 12 pmol/cm2 RGD surfaces that significantly differed from 46 pmol/cm2 RGD surfaces at the P-value levels P < 0.05 and P < 0.01 are denoted by one and two asterisks, respectively
Fig. 3
Fig. 3
Focal adhesion growth and actin filament reorganization in A431 cells exposed to soluble EGF. Cells were plated on surfaces modified with 184 pmol/cm2 RGD. Five hours after cell plating, EGF was added to the medium for 30 min. A separate cell sample was incubated for 5.5 h without EGF, as a control. After 5.5 h, both samples were fixed and stained for zyxin at focal adhesions and for actin filaments. The graphs in the top panel indicate the 90th percentile of the focal adhesion elongation (a), the average number of focal adhesions per cell (b), and area (c) as a function of EGF concentration. All results are expressed as mean ± confidence intervals (CI). Parameters of FAs in cells that were exposed to soluble EGF and significantly differed from the corresponding parameters of FAs in control cell, not exposed to EGF, at the P-value levels P < 0.05 and P < 0.01 are denoted by one and two asterisks, respectively. Fluorescent images of actin- and zyxin-labeled cells exposed to 1 and 10 ng/ml, in comparison to control (no EGF) are presented in the bottom panel (d). Scale bar 15 μm
Fig. 4
Fig. 4
The effect of RGD density on cell adhesion in response to soluble EGF. Average number of focal adhesions per cell as a function of EGF concentration on surfaces with different RGD densities (a), the numbers at the top right of the graphs are the RGD density in pmol/cm2. Low bars with dashed borders represent a scenario where cells detached from the surface. The insert in a, at the top left represents the same data as that seen in the main graph, where the average number of focal adhesions per cell are plotted as a function of the surface RGD density. The numbers at the top of each graph represent the applied EGF concentrations in ng/ml. All results are expressed as mean ± confidence intervals (CI). Number of FAs in cells plated on 46, 92 and 184 pmol/cm2 RGD surfaces that were significantly higher than the number of FAs in cells plated on both 6 and 12 pmol/cm2 RGD surfaces at the P-value levels P < 0.05 and P < 0.002 are denoted by one and two asterisks, respectively. The images in the bottom panel are of A431 cells, plated on surfaces modified with RGD at different densities, following stimulation with 1 ng/ml EGF. The number on each image indicates the RGD density in pmol/cm2. The experimental procedure was the same as that described in the legend to Fig. 3. Scale bar 15 μm
Fig. 5
Fig. 5
A comparison between cell response to immobilized and soluble EGF as a function of RGD density and total EGF amounts. For comparison, the amounts of immobilized and soluble EGF are calculated for the given well area or the given volume, respectively. The 70th percentile of the cell area (b) and cell aspect ratio (c) are summarized for cells plated on either 12 (dashed line) or 46 (solid line) pmol/cm2 RGD-modified surfaces as a function of the amount of immobilized (Imm dark circles) or soluble (Sol empty diamond) EGF. The average numbers of focal adhesions per cell as a function of EGF are presented for cells plated on 46 pmol/cm2 RGD surfaces (a). All results are expressed as mean ± confidence intervals (CI). Number of FAs per cell or cell area for cells plated on 46 pmol/cm2 RGD surfaces and (4.19 ± 1.04) × 103 fmol immobilized EGF that were significantly different from the same parameters of cells exposed to the same amount of soluble EGF at the P-value level P < 0.05 are denoted by one asterisks. This mark also indicate the P value level for the differences between the parameters of cells plated on (0.75 ± 0.28) × 103 and (4.19 ± 1.04) × 103 fmol immobilized EGF. Aspect ratio of cells plated on 12 or 46 pmol/cm2 RGD surfaces and (4.19 ± 1.04) × 103 fmol immobilized EGF differed from cells plated on RGD only surfaces at a P-value of P < 0.05 (*) and P < 0.01 (**), respectively. Bottom panel images of zyxin- and actin-labeled A431 cells, plated on surfaces modified with 46 pmol/cm2 RGD and various amounts of immobilized (d) or soluble EGF (e). Cells were incubated on the different surfaces for 5 h, and then fixed and stained for zyxin and actin. Scale bar 15 μm

Similar articles

Cited by

References

    1. Cavalcanti-Adam EA, Volberg T, Micoulet A, Kessler H, Geiger B and Spatz JP, Biophys J 92(8), 2964 (2007)10.1529/biophysj.106.089730. - DOI - PMC - PubMed
    1. Miyamoto S, Teramoto H, Gutkind JS and Yamada KM, J Cell Biol 135(6), 1633 (1996)10.1083/jcb.135.6.1633. - DOI - PMC - PubMed
    1. Are A, Pinaev G, Burova E and Lindberg U, Cell Motil Cytoskeleton 48(1), 24 (2001)10.1002/1097-0169(200101)48:1<24::AID-CM3>3.0.CO;2-9. - DOI - PubMed
    1. Genersch E, Schuppan D and Lichtner RB, J Mol Med 74(10), 609 (1996)10.1007/s001090050064. - DOI - PubMed
    1. Pichard V, Honore S, Kovacic H, Li CG, Prevot C, Briand C and Rognoni JB, Histochem Cell Biol 116(4), 337 (2001)10.1007/s004180100324. - DOI - PubMed

Publication types