. 2012 May 15;72(10):2578-88.
doi: 10.1158/0008-5472.CAN-11-3732.

Loss of cell-surface laminin anchoring promotes tumor growth and is associated with poor clinical outcomes

Affiliations

Loss of cell-surface laminin anchoring promotes tumor growth and is associated with poor clinical outcomes

Armin Akhavan et al. Cancer Res. .

Abstract

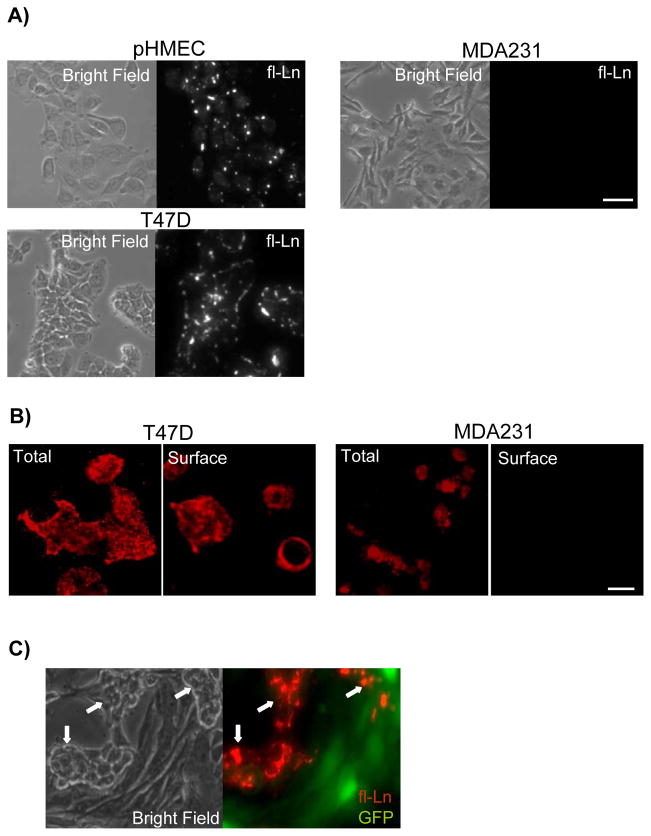
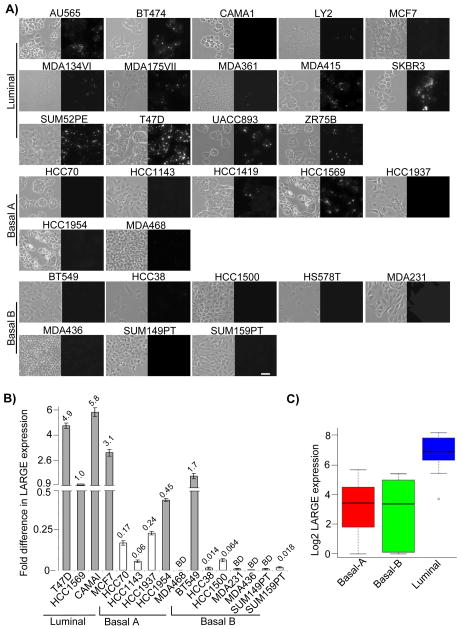
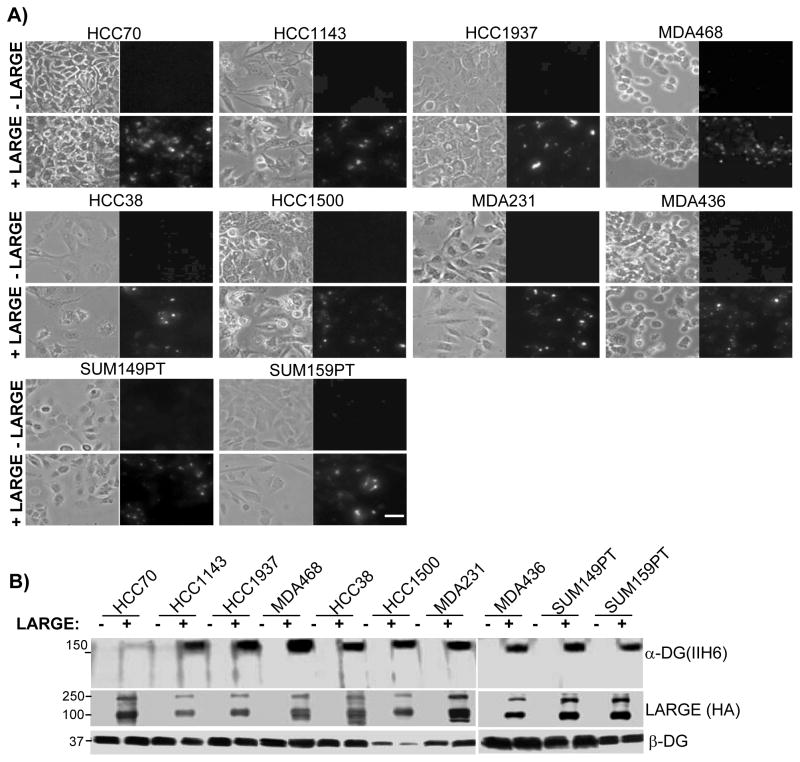
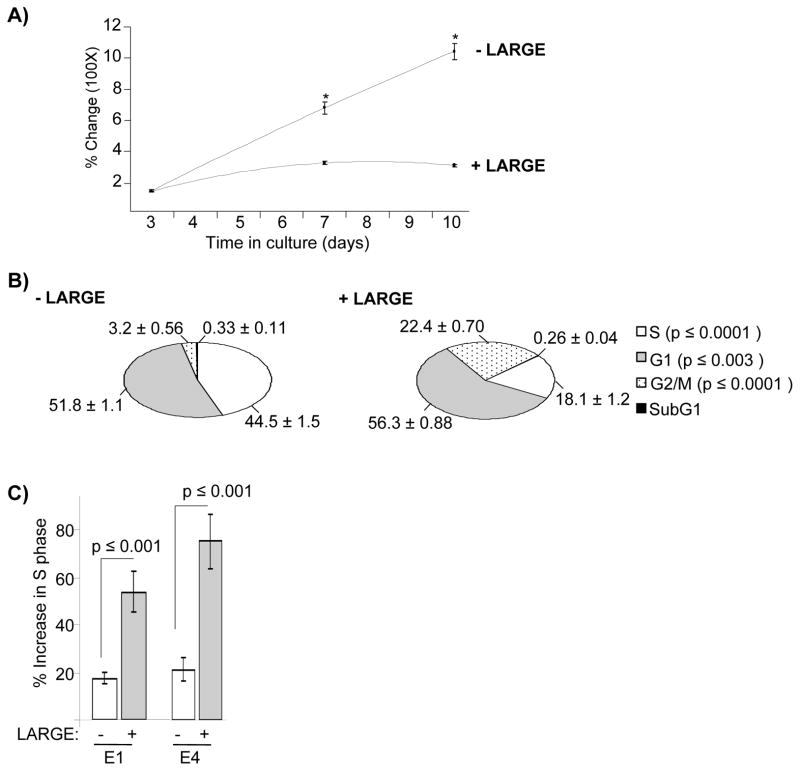
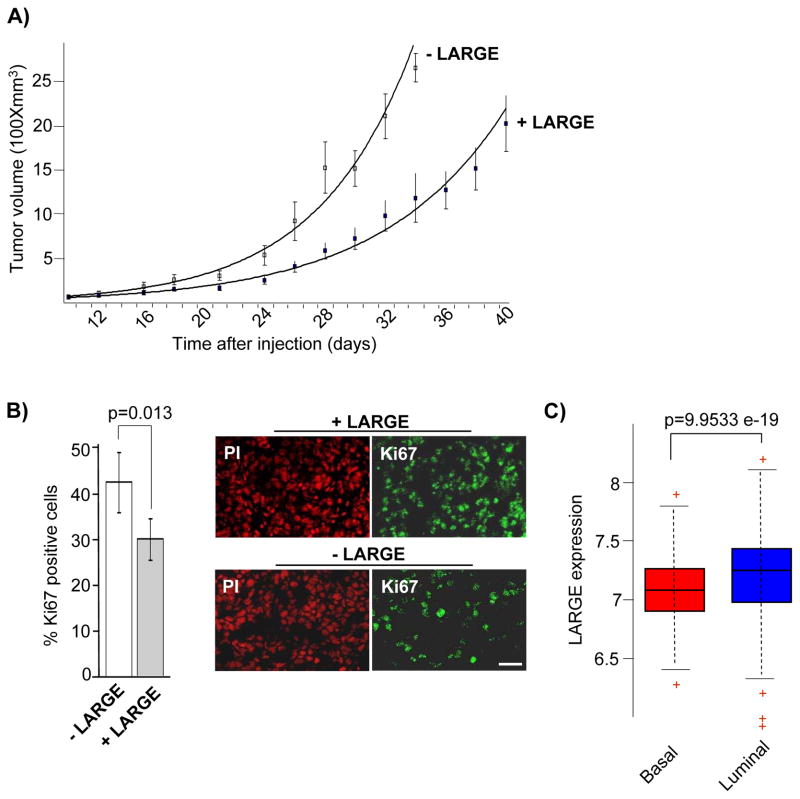
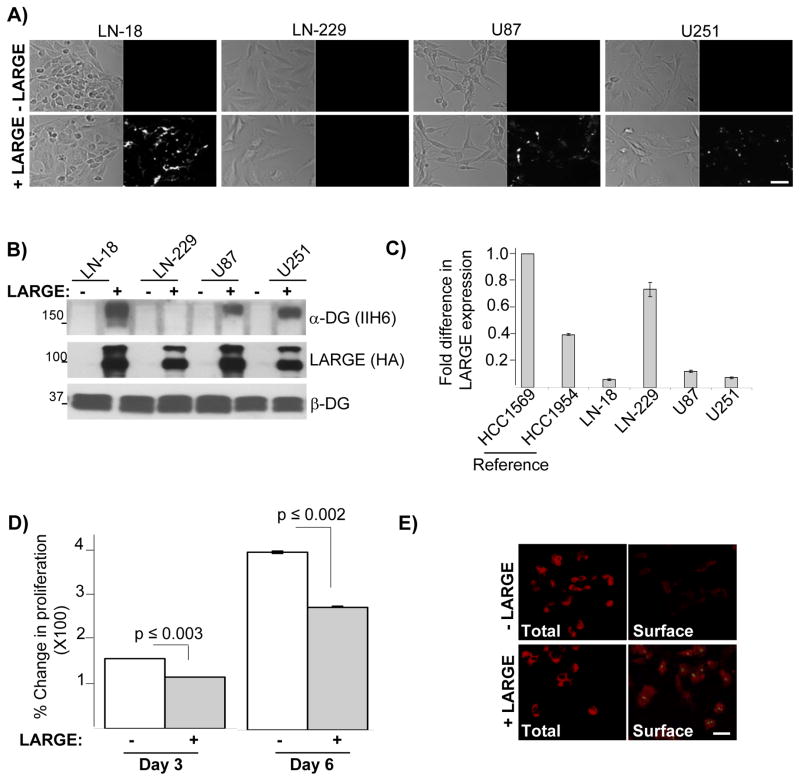
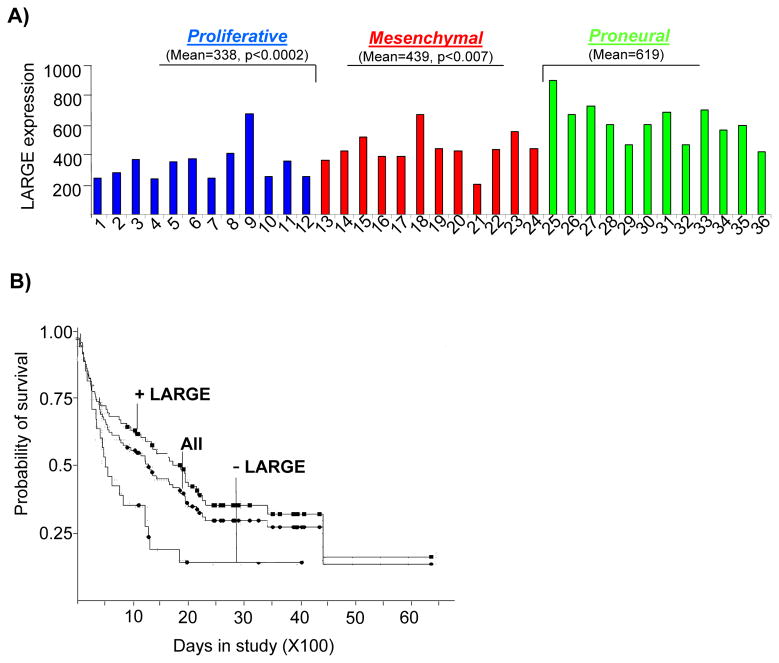
Perturbations in the composition and assembly of extracellular matrices (ECM) contribute to progression of numerous diseases, including cancers. Anchoring of laminins at the cell surface enables assembly and signaling of many ECMs, but the possible contributions of altered laminin anchoring to cancer progression remain undetermined. In this study, we investigated the prominence and origins of defective laminin anchoring in cancer cells and its association with cancer subtypes and clinical outcomes. We found loss of laminin anchoring to be widespread in cancer cells. Perturbation of laminin anchoring originated from several distinct defects, which all led to dysfunctional glycosylation of the ECM receptor dystroglycan. In aggressive breast and brain cancers, defective laminin anchoring was often due to suppressed expression of the glycosyltransferase LARGE. Reduced expression of LARGE characterized a broad array of human tumors in which it was associated with aggressive cancer subtypes and poor clinical outcomes. Notably, this defect robustly predicted poor survival in patients with brain cancers. Restoring LARGE expression repaired anchoring of exogenous and endogenous laminin and modulated cell proliferation and tumor growth. Together, our findings suggest that defects in laminin anchoring occur commonly in cancer cells, are characteristic of aggressive cancer subtypes, and are important drivers of disease progression.


Conflict of interest statement

No conflicts of interest exist among the authors.

Figures

Figure 1
Figure 1. Absence of laminin anchorage is a cell autonomous defect in breast cancer cells
A) Normal primary human mammary epithelial cells (pHMECs) and breast cancer cell lines were treated with fl-Ln overnight and imaged by phase (left) and fluorescence (right) microscopy. B) Immunofluorescence staining of total and surface-bound endogenous laminin in breast cancer cell lines revealed laminin expression in all cells, but an absence of surface-bound laminin in MDA231 cells. C) T47D cells and GFP-expressing MDA231 cells were co-cultured, treated with fl-Ln overnight and imaged by phase (left) and fluorescence (right) microscopy. The morphologically distinct T47D cells (white arrows) retained the capacity for anchorage of fl-Ln (red, right) whereas the MDA231 cells (green, right) remained anchorage-deficient. (Bars = 25 μm).
Figure 2
Figure 2. Absence of laminin anchorage and LARGE expression are common defects of breast cancer cell lines of distinct subtypes
A) The indicated human breast cancer cell lines were treated with fl-Ln overnight and imaged by phase (left) and fluorescence (right) microscopy. Cell lines are grouped by subtype (labeled on the left) and shown in alphabetical order. (Bar = 25 μm). B) mRNA obtained from indicated cell lines were subjected to real time RT-PCR using specific primary for human LARGE and GAPDH. T47D and HCC1569 are shown as references. The fold difference in LARGE mRNA expression is indicated above each bar. White bars indicate cell lines designated to lack expression of LARGE mRNA and BD indicates signals that are below detection, as described in supplementary material and methods. C) The boxplot illustrates the gene-level expression of LARGE in 26 breast cancer cell line relative to the distribution of all gene expression values in breast cancer cell subtypes. Higher expression levels in luminal relative to basal-A/B (grouped) subtypes are statistically significantly (p=6.696e-05).
Figure 3
Figure 3. Expression of exogenous LARGE restores laminin anchorage and DG glycosylation in cells lacking LARGE expression
A) The indicated cells infected with cDNA encoding the HA-tagged LARGE (+LARGE) or control vector (−LARGE) were treated with fl-Ln and imaged by phase (left) and fluorescence (right) microscopy. (Bars = 25 μm). B) Protein extracts from indicated cell line were immunoblotted using the indicated antibodies. Molecular weights are shown on the left.
Figure 4
Figure 4. Restoration of laminin anchorage in breast cancer cells slows cell proliferation
A) CAMAI cells expressing LARGE (+LARGE) or vector control (−LARGE) were maintained in culture and percent change in OD measurements obtained from MTT assays were plotted against time. Statistically significant differences are shown by * (p ≥ 0.0003) B) CAMAI cells were treated with BrdUrd, fixed and stained with an anti-BrdUrd antibody and propidium iodide and subjected to cell cycle analysis by FACS. The numbers on the pie chart indicated percentage (± standard errors) of cells in each phase of cell cycle. The insert on the right denotes cell cycle phases corresponding to the pie chart as well as the p values representing statistically significant differences between −LARGE and +LARGE. C) Percent change in S phase with (+) or without (−) treatment with laminin fragments E1 and E4 was calculated and plotted as histogram bars for CAMAI cells −LARGE (white bars) and +LARGE (gray bars). Standard errors and p values are shown.
Figure 5
Figure 5. Reduced expression of LARGE promotes tumorigenicity in vivo and is associated with aggressive human breast cancers
A) Tumor volumes generated by orthotropic injection of MDA231 cells expressing either vector control (−LARGE) or LARGE (+LARGE) are plotted against time post-injection along with standard errors. Differences in tumor volumes formed by −LARGE and +LARGE cells are statistically significant (p ≤ ranging from 0.05 to 0.001) from day 18 onward. B) Tumors generated by MDA231 cells were sectioned, stained with a human specific anti-Ki67 antibody and propidium iodide, and imaged by confocal microscopy. Representative images are shown on the right. Two regions from of each tumor section was imaged to compare the percent of cells displaying Ki67 staining in tumors generated by vector control (−LARGE) or LARGE (+LARGE) expressing MDA231 cells. Standard errors and p values are shown. (Bar = 20 μm) C) The expression of LARGE mRNA was examined in microarray data obtained from a 508 sample tumor cohort (MD Anderson GSE25066A data set) previously categorized into different subtypes. Statistical significance (p=9.9533e-19) between the Basal and Luminal A and B (grouped) is shown.
Figure 6
Figure 6. Defective laminin anchorage is a characteristic of glioblastoma cells arising primarily from lack of LARGE expression and conferring enhanced cell proliferation
A) Indicated glioblastoma cells expressing LARGE (+LARGE) or vector control (−LARGE) were treated with fl-Ln and imaged by phase (left) and fluorescence (right) microscopy. B) Protein extracts from the cells described in A were subjected to immunoblot analysis with the indicated antibodies. C) Real-time RT-PCR analysis of LARGE expression from indicated glioblastoma cell lines were assessed and compared to two breast cancer cell lines. Expression levels are relative to LARGE expression in HCC1569 cells. D) LN-18 cells expressing vector control (white bars) or LARGE (gray bars) were maintained in culture and percent change in OD measurements obtained from MTT assays at indicated points were plotted along with standard errors. Statistically significant differences and the corresponding p are shown. E) Immunofluorescence of total (total) and surface-bound laminin (Surface) co-stained with LARGE in LN-18 cells expressing LARGE or vector control. Laminin and LARGE are shown in red and green, respectively. (Bars = 25 μm).
Figure 7
Figure 7. Reduced LARGE expression is associated with aggressive gliomas and poor patient survival
A) Normalized mean gene expression levels for LARGE in 36 human glioblastoma samples are displayed. The samples belong to three distinct molecular subclasses; proliferative (samples 1–12), mesenchymal (samples 13–25) and proneural (samples 26–37) which correlate strongly with patient survival. P values shown are relative to Proneural. B) Kaplan Meier survival plots for astrocytomas from the Rembrandt database are displayed with respect to LARGE expression levels. Survival data for all samples (All), samples with down regulated LARGE (− LARGE) and samples excluding LARGE down regulation (+LARGE) are shown. Log-rank test for − LARGE and + LARGE is p ≤ 0.037. Statistically significant association with LARGE expression and poor survival were also obtained in Kaplan Meier survival plots of all gliomas (not shown), p=7.9e-7.

References

    1. Hu M, Polyak K. Microenvironmental regulation of cancer development. Curr Opin Genet Dev. 2008;18:27–34. - PMC - PubMed
    1. Anderson AR, Weaver AM, Cummings PT, Quaranta V. Tumor morphology and phenotypic evolution driven by selective pressure from the microenvironment. Cell. 2006;127:905–15. - PubMed
    1. Schafer ZT, Grassian AR, Song L, Jiang Z, Gerhart-Hines Z, Irie HY, et al. Antioxidant and oncogene rescue of metabolic defects caused by loss of matrix attachment. Nature. 2009;461:109–13. - PMC - PubMed
    1. Levental KR, Yu H, Kass L, Lakins JN, Egeblad M, Erler JT, et al. Matrix crosslinking forces tumor progression by enhancing integrin signaling. Cell. 2009;139:891–906. - PMC - PubMed
    1. Egeblad M, Werb Z. New functions for the matrix metalloproteinases in cancer progression. Nat Rev Cancer. 2002;2:161–74. - PubMed

Publication types