

Energetics of stalk intermediates in membrane fusion are controlled by lipid composition
- PMID: 22589300
- PMCID: PMC3382523
- DOI: 10.1073/pnas.1119442109
Energetics of stalk intermediates in membrane fusion are controlled by lipid composition
Abstract
We have used X-ray diffraction on the rhombohedral phospholipid phase to reconstruct stalk structures in different pure lipids and lipid mixtures with unprecedented resolution, enabling a quantitative analysis of geometry, as well as curvature and hydration energies. Electron density isosurfaces are used to study shape and curvature properties of the bent lipid monolayers. We observe that the stalk structure is highly universal in different lipid systems. The associated curvatures change in a subtle, but systematic fashion upon changes in lipid composition. In addition, we have studied the hydration interaction prior to the transition from the lamellar to the stalk phase. The results indicate that facilitating dehydration is the key to promote stalk formation, which becomes favorable at an approximately constant interbilayer separation of 9.0 ± 0.5 Å for the investigated lipid compositions.
Conflict of interest statement
The authors declare no conflict of interest.
Figures
 ,
,  ,
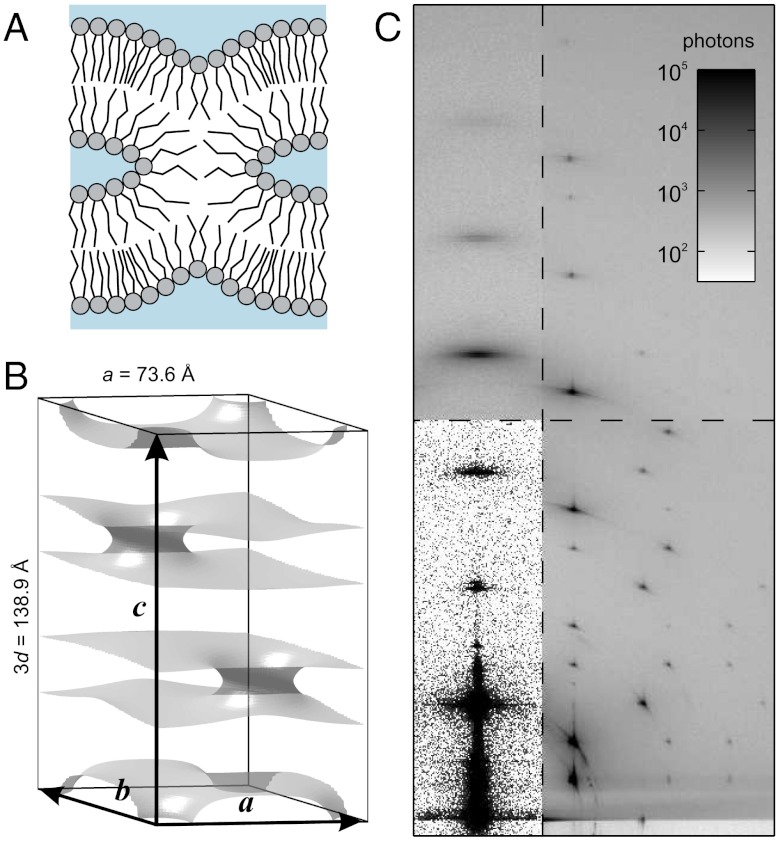
,  . Shown is the electron density isosurface Δρ = 0.3 (DOPC/DOPE 1∶1, RH = 74%). (C) Grazing-incidence X-ray diffraction pattern of the stalk phase (DPhPC, RH = 70%, recorded at the MS beamline, Swiss Light Source) composed of four overlapping Pilatus images. An attenuator with a transmission of 10-3 was used in case of the detector position covering primary and specular beam.
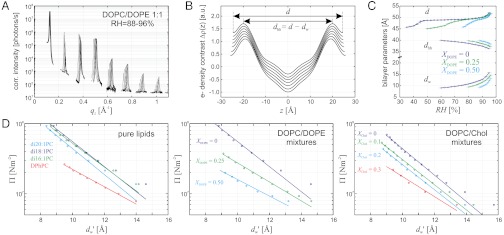
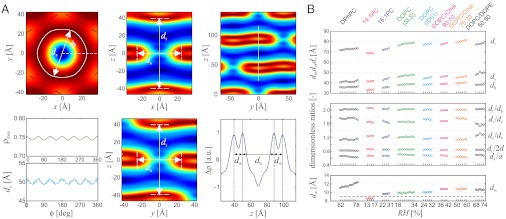
 in the xy plane and corresponding stalk waist diameter ds and maximum electron density contrast (left), slices through a stalk in the xz and yz plane (center) and slice through the stalk phase in the yz plane and electron density along the white line in vertical direction (right) (DOPC/DOPE 1∶1, RH = 74%). (B) Summary of results for eight different datasets. In the bottom box, the dashed line indicates the value
  , at which the transition from the lamellar to the rhombohedral phase starts. For most lipid compositions, formation of the stalk phase is associated with an increase of dw.
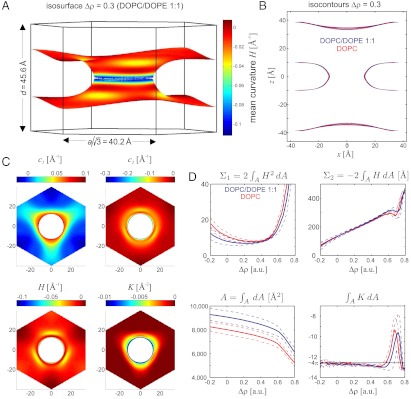
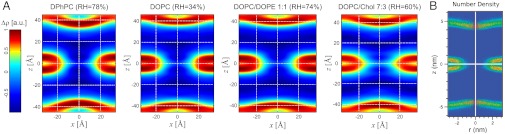
 for DOPC/DOPE 1∶1 (RH = 70%). (B) Isocontours Δρ = 0.3 at different hydration levels for stalks formed by pure DOPC and DOPC/DOPE 1∶1 indicating a very similar structure. (C) Principle curvatures c1,2, mean curvature H and Gaussian curvature K for
  (top view) and (D) results of the integrals Σ1, Σ2, A, ∫KdA.
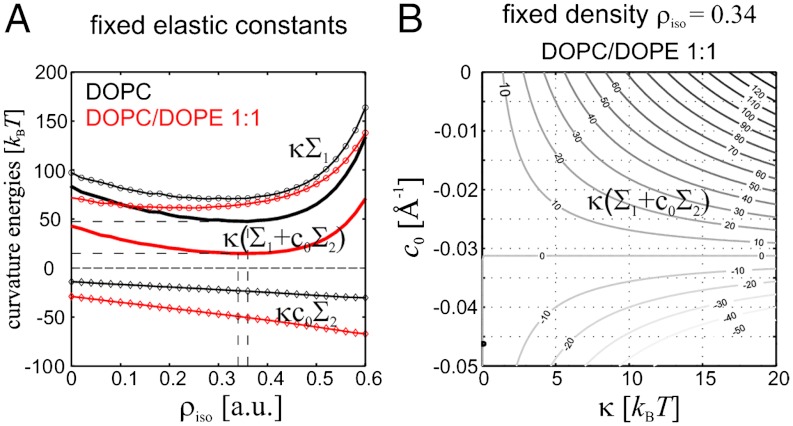
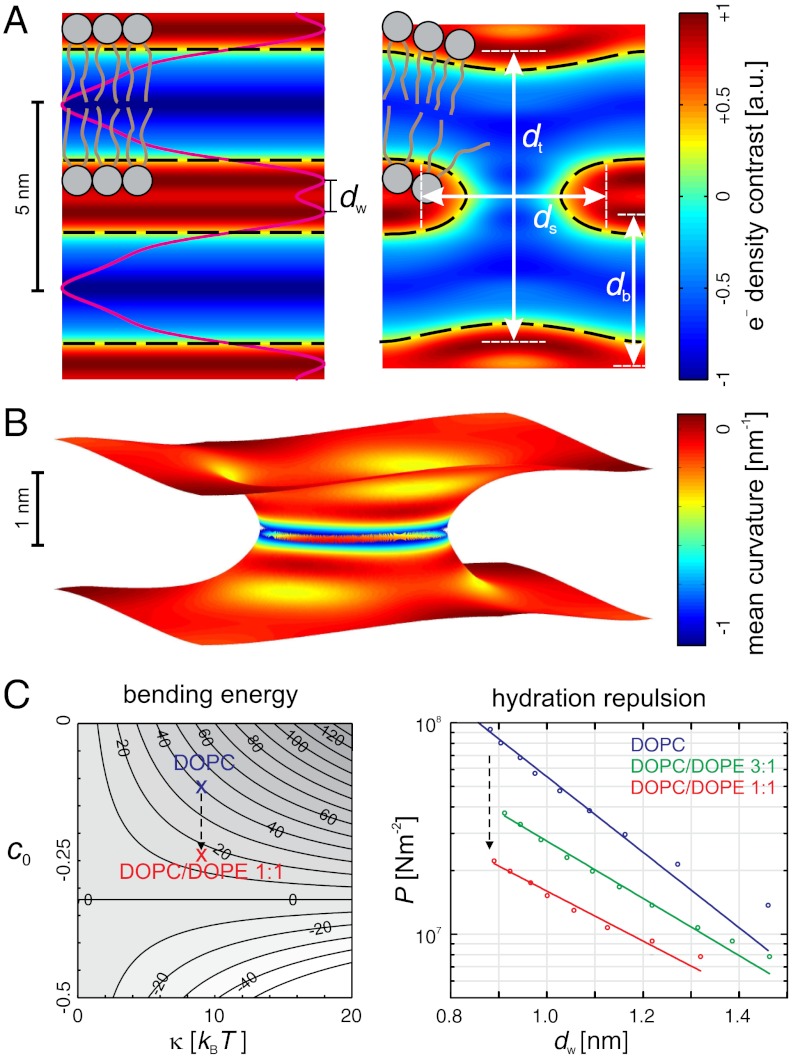
 . The dashed black lines indicate contours of constant electron density contrast Δρ = 0.3. (B) Corresponding 3D electron density isosurface and the local distribution of mean curvature H. (C) Energy landscape of the bending energy (κ/2)∫(2H - c0)2dA (left). Published values of the elastic coefficients lead to about 15 kBT. Pressure-distance curves P(dw) in the lamellar phase (right) allow determination of the energy required for dehydration to
  .
.References
-
- Jahn R, Lang T, Südhof TC. Membrane fusion. Cell. 2003;112:519–533. - PubMed
-
- Martens S, McMahon HT. Mechanisms of membrane fusion: disparate players and common principles. Nat Rev Mol Cell Biol. 2008;9:543–556. - PubMed
-
- Chernomordik LV, Kozlov MM. Membrane hemifusion: crossing a chasm in two leaps. Cell. 2005;123:375–382. - PubMed
-
- Xu Y, Zhang F, Su Z, McNew JA, Shin YK. Hemifusion in SNARE-mediated membrane fusion. Nat Struct Mol Biol. 2005;12:417–422. - PubMed
Publication types
MeSH terms
Substances
LinkOut - more resources
Full Text Sources
