Modelling fungal sink competitiveness with grains for assimilates in wheat infected by a biotrophic pathogen
- PMID: 22589327
- PMCID: PMC3380591
- DOI: 10.1093/aob/mcs094
Modelling fungal sink competitiveness with grains for assimilates in wheat infected by a biotrophic pathogen
Abstract
Background and aims: Experiments have shown that biotrophic fungi divert assimilates for their growth. However, no attempt has been made either to account for this additional sink or to predict to what extent it competes with both grain filling and plant reserve metabolism for carbon. Fungal sink competitiveness with grains was quantified by a mixed experimental-modelling approach based on winter wheat infected by Puccinia triticina.
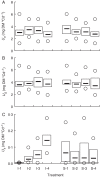
Methods: One week after anthesis, plants grown under controlled conditions were inoculated with varying loads. Sporulation was recorded while plants underwent varying degrees of shading, ensuring a range of both fungal sink and host source levels. Inoculation load significantly increased both sporulating area and rate. Shading significantly affected net assimilation, reserve mobilization and sporulating area, but not grain filling or sporulation rates. An existing carbon partitioning (source-sink) model for wheat during the grain filling period was then enhanced, in which two parameters characterize every sink: carriage capacity and substrate affinity. Fungal sink competitiveness with host sources and sinks was modelled by representing spore production as another sink in diseased wheat during grain filling.
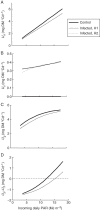
Key results: Data from the experiment were fitted to the model to provide the fungal sink parameters. Fungal carriage capacity was 0·56 ± 0·01 µg dry matter °Cd(-1) per lesion, much less than grain filling capacity, even in highly infected plants; however, fungal sporulation had a competitive priority for assimilates over grain filling. Simulation with virtual crops accounted for the importance of the relative contribution of photosynthesis loss, anticipated reserve depletion and spore production when light level and disease severity vary. The grain filling rate was less reduced than photosynthesis; however, over the long term, yield loss could double because the earlier reserve depletion observed here would shorten the duration of grain filling.
Conclusions: Source-sink modelling holds the promise of accounting for plant-pathogen interactions over time under fluctuating climatic/lighting conditions in a robust way.
Figures


References
-
- Andreev LN, Plotnikova YM, Serezkhina GV. Haustoria of Puccinia graminis Pers. f. sp. tritici Eriks. & Henn. in the vascular system of wheat. Mikologiya i Fitopatologiya. 1982;16:335–338.
-
- Ayres PG, West HM. Stress responses in plants infected by pathogenic and mutualistic fungi. In: Fowden L, Mansfield T, Stoddart J, editors. Plant adaptation to environmental stress. London: Chapman & Hall; 1993. pp. 295–311.
-
- Ayres PG, Colin Press M, Spencer-Phillips PTN. Effects of pathogens and parasitic plants on source sink relationships. In: Zamski E, Schaffer AA, editors. Photoassimilate distribution in plants and crops. Source–sink relationships. New York: Marcel Dekker, Inc; 1996. pp. 479–499.
-
- Bancal P, Soltani F. Source-sink partitioning. Do we need Munch? Journal of Experimental Botany. 2002;53:1919–1928. - PubMed

