. 2012 May 15;5(224):rs4.
doi: 10.1126/scisignal.2002612.

MicroSCALE screening reveals genetic modifiers of therapeutic response in melanoma

Affiliations

MicroSCALE screening reveals genetic modifiers of therapeutic response in melanoma

Kris C Wood et al. Sci Signal. .

Abstract

Cell microarrays are a promising tool for performing large-scale functional genomic screening in mammalian cells at reasonable cost, but owing to technical limitations they have been restricted for use with a narrow range of cell lines and short-term assays. Here, we describe MicroSCALE (Microarrays of Spatially Confined Adhesive Lentiviral Features), a cell microarray-based platform that enables application of this technology to a wide range of cell types and longer-term assays. We used MicroSCALE to uncover kinases that when overexpressed partially desensitized B-RAFV600E-mutant melanoma cells to inhibitors of the mitogen-activated protein kinase kinase kinase (MAPKKK) RAF, the MAPKKs MEK1 and 2 (MEK1/2, mitogen-activated protein kinase kinase 1 and 2), mTOR (mammalian target of rapamycin), or PI3K (phosphatidylinositol 3-kinase). These screens indicated that cells treated with inhibitors acting through common mechanisms were affected by a similar profile of overexpressed proteins. In contrast, screens involving inhibitors acting through distinct mechanisms yielded unique profiles, a finding that has potential relevance for small-molecule target identification and combination drugging studies. Further, by integrating large-scale functional screening results with cancer cell line gene expression and pharmacological sensitivity data, we validated the nuclear factor κB pathway as a potential mediator of resistance to MAPK pathway inhibitors. The MicroSCALE platform described here may enable new classes of large-scale, resource-efficient screens that were not previously feasible, including those involving combinations of cell lines, perturbations, and assay outputs or those involving limited numbers of cells and limited or expensive reagents.


Figures

Fig. 1
Fig. 1. The MicroSCALE screening platform
(A) General schematic depicting screening with MicroSCALE. (B) MicroSCALE arrays printed with GFP-expressing lentiviruses were seeded with the indicated cell lines and fixed and imaged after 4 days (GFP fluorescence shown). Scale bar, 1 mm. (C) MicroSCALE arrays printed with GFP-expressing lentiviruses were seeded with U2OS cells and incubated for 4 days with (right) or without (left) puromycin selection during days 1-4 (blue: Hoechst; green: GFP). Scale bars, 1 mm (top panels) and 500 μm (bottom panels). IF, immunofluorescence; TICs, tumor-initiating cells.
Fig. 2
Fig. 2. MicroSCALE screening applications
(A) Top: Slides were fixed and stained (Hoechst) on the indicated number of days following seeding and U2OS cell numbers were determined by counting the number of nuclei per spot (n=4 replicate spots per condition). Bottom: Images of replicate features expressing the indicated hairpins 2 and 6 days following seeding. (B) Slides were stained (Hoechst) on day 6 and relative viabilities were determined using the background subtracted staining intensity on each feature (n=4 replicate spots per condition). P values are relative to the shGFP control. HCC827 cells have a constitutively active mutant form of the EGFR, U2OS cells are wildtype for KRAS, and MDA-MB-231 have a constitutively active mutant form of KRAS. (C) Slides were stained [Hoechst and an antibody recognizing phosphorylated S6 (P-S6)] on day 5 and total P-S6 staining intensity was background subtracted and normalized to Hoechst intensity (n=4 replicate spots per condition). (D) Kinome ORF MicroSCALE arrays. Features are 600 μm in diameter with 750 μm center-to-center spacing. The two features in the bottom right hand corner of each 6×6 sub-grid are control spots containing no virus. Arrays were stained (Syto82) on day 6. Scale bars, 10 mm and 1 mm (inset). (E) Results of a PLX4720 (1 μM) modifier screen in A375 cells. Average viability scores of individual ORFs are shown (each normalized to vehicle-only treatment), with the top 10% of ORFs shaded in gray. Red bars represent the top 10 wild-type ORFs from an analogous multiwell plate-based screen (32) and blue arrows indicate the scores of 5 MAPK pathway mutant positive control ORFs (see text for details; n=12 or 18 replicate spots per ORF). The top 10% of ORFs in the screen are shaded in gray, and selected wild-type (red) and mutant (blue) ORFs from this region are listed along with their individual scores in the inset. (F) Images of replicate spots on a PLX4720-treated array, including hits from ORFs with MAPK pathway mutants (blue), hit from ORFs with wild-type genes (red), and ORFs with control genes (black). Cells were selected with puromycin in (A-C) and blasticidin in (D-F).
Fig. 3
Fig. 3. Integrating the results of MicroSCALE screens with pharmacogenomic data to identify genetic modifiers of therapeutic response in melanoma
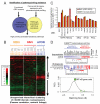
(A) Schematic depicting an approach to discover high priority resistance genes and pathways. (B) Heat map showing the results of modifier screens. Columns represent individual arrays (2-5 replicate arrays were screened for each drug) and rows represent the average proliferation score of each ORF (drug/vehicle; n=2 or n=3 replicate spots for each ORF on the array). Unsupervised hierarchical clustering of rows and columns was performed (for simplicity, the dendrogram representing the results of row-based clustering is not shown). Scale bar indicates Z-scores (standard deviations from the column mean; see Materials and Methods). (C) Validated hits that decrease the sensitivity of A375 cells to MAPK pathway inhibitors are shown grouped into functional categories (n=3 replicate wells per condition). (D) Top: Heat map depicting PLX4720 and AZD-6244 GI50 values for a panel of 25 B-RAFV600-mutant melanoma cell lines. GI50 values are row (drug) normalized and Z-transformed. Bottom: Heat map showing single-sample GSEA scores for three gene sets annotating NF-κB activation. The matching scores of the NF-κB gene sets against PLX4720’s GI50 profile reveal a significant enrichment of those gene sets in PLX4720- and AZD-6244-resistant cell lines. (A perfect match (antimatch) corresponds to a matching score of +1(−1) and a random match to 0.) The histogram depicts the matching scores of 3,264 gene sets (MSigDB/C2 v3.0) against PLX4720’s GI50 profile, with the scores of the NF-κB gene sets highlighted by green lines.
Fig. 4
Fig. 4. Effects of NF-κB activation in B-RAFV600-mutant melanomas treated with MAPK pathway inhibitors
(A) Effects of IKBKB or TRAF2 overexpression or the addition of exogenous TNFα (25 ng/mL) on GI50 concentrations for RAF, MEK1/2, or ERK-2 inhibitors in four B-RAFV600-mutant melanoma cell lines (n=3 replicate GI50 curves per condition). Overexpression of MEK1 serves as a negative control. (B) Effects of IKBKB or TRAF2 overexpression or exogenous TNFα (25 ng/mL) on phosphorylation of RelA and phosphorylation of ERK in the presence of PLX4720 (A375 cells; three replicate experiments were performed and representative blots are shown). MEK1 serves as a negative control ORF. CRAF serves as a positive control ORF which activates the MAPK pathway in the presence of PLX4720. (C) Effects of exogenous TNFα (25 ng/mL) on apoptosis induction [as indicated by Annexin V(+) / propidium iodide (PI) (-) staining] and cell cycle arrest induced by PLX4720 (A375 cells; three replicate experiments were performed and representative plots are shown). (D) Correlation between NF-κB gene expression signatures and resistance to MAPK pathway inhibitors in patient-derived B-RAFV600-mutant melanoma short-term cultures (n=3 replicate GI50 curves per condition). Cell lines with corresponding GI50 data are in bold. The Y-axis does not extend beyond 10 μM, which is the upper limit of this assay.

References

    1. Shapira SD, Gat-Viks I, Shum BO, Dricot A, de Grace MM, Wu L, Gupta PB, Hao T, Silver SJ, Root DE, Hill DE, Regev A, Hacohen N. A physical and regulatory map of host-influenza interactions reveals pathways in H1N1 infection. Cell. 2009;139:1255. - PMC - PubMed
    1. Brass AL, Dykxhoorn DM, Benita Y, Yan N, Engelman A, Xavier RJ, Lieberman J, Elledge SJ. Identification of host proteins required for HIV infection through a functional genomic screen. Science. 2008;319:921. - PubMed
    1. Moffat J, Grueneberg DA, Yang X, Kim SY, Kloepfer AM, Hinkle G, Piqani B, Eisenhaure TM, Luo B, Grenier JK, Carpenter AE, Foo SY, Stewart SA, Stockwell BR, Hacohen N, Hahn WC, Lander ES, Sabatini DM, Root DE. A lentiviral RNAi library for human and mouse genes applied to an arrayed viral high-content screen. Cell. 2006;124:1283. - PubMed
    1. Barbie DA, Tamayo P, Boehm JS, Kim SY, Moody SE, Dunn IF, Schinzel AC, Sandy P, Meylan E, Scholl C, Frohling S, Chan EM, Sos ML, Michel K, Mermel C, Silver SJ, Weir BA, Reiling JH, Sheng Q, Gupta PB, Wadlow RC, Le H, Hoersch S, Wittner BS, Ramaswamy S, Livingston DM, Sabatini DM, Meyerson M, Thomas RK, Lander ES, Mesirov JP, Root DE, Gilliland DG, Jacks T, Hahn WC. Systematic RNA interference reveals that oncogenic KRAS-driven cancers require TBK1. Nature. 2009;462:108. - PMC - PubMed
    1. Mohr S, Bakal C, Perrimon N. Ann Rev Biochem. (Annual Reviews, Palo Alto, 2010) 79:37–64. - PMC - PubMed

Publication types

Substances