Comparative Study
. 2012 Jun 22;53(7):3939-50.
doi: 10.1167/iovs.12-9979.

Structural and functional abnormalities of retinal ganglion cells measured in vivo at the onset of optic nerve head surface change in experimental glaucoma

Affiliations
Comparative Study

Structural and functional abnormalities of retinal ganglion cells measured in vivo at the onset of optic nerve head surface change in experimental glaucoma

Brad Fortune et al. Invest Ophthalmol Vis Sci. .

Abstract

Purpose: To compare peripapillary retinal nerve fiber layer thickness (RNFLT), RNFL retardance, and retinal function at the onset of optic nerve head (ONH) surface topography change in experimental glaucoma (EG).

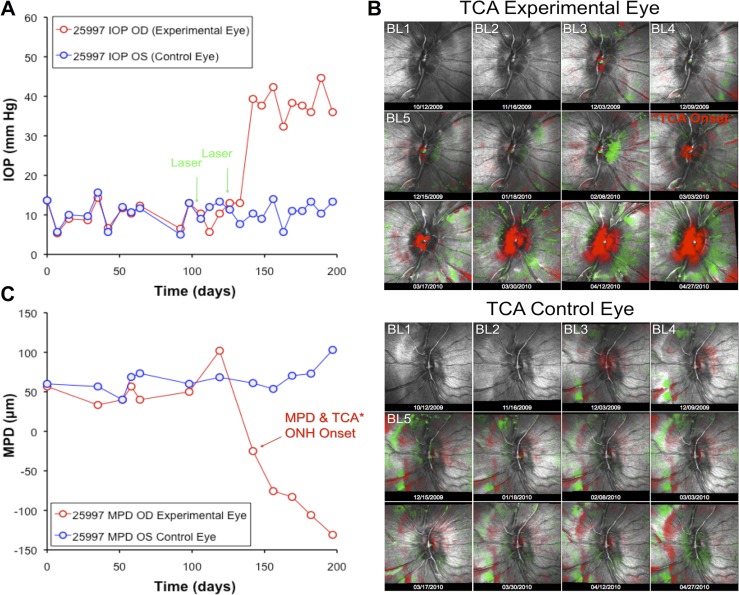
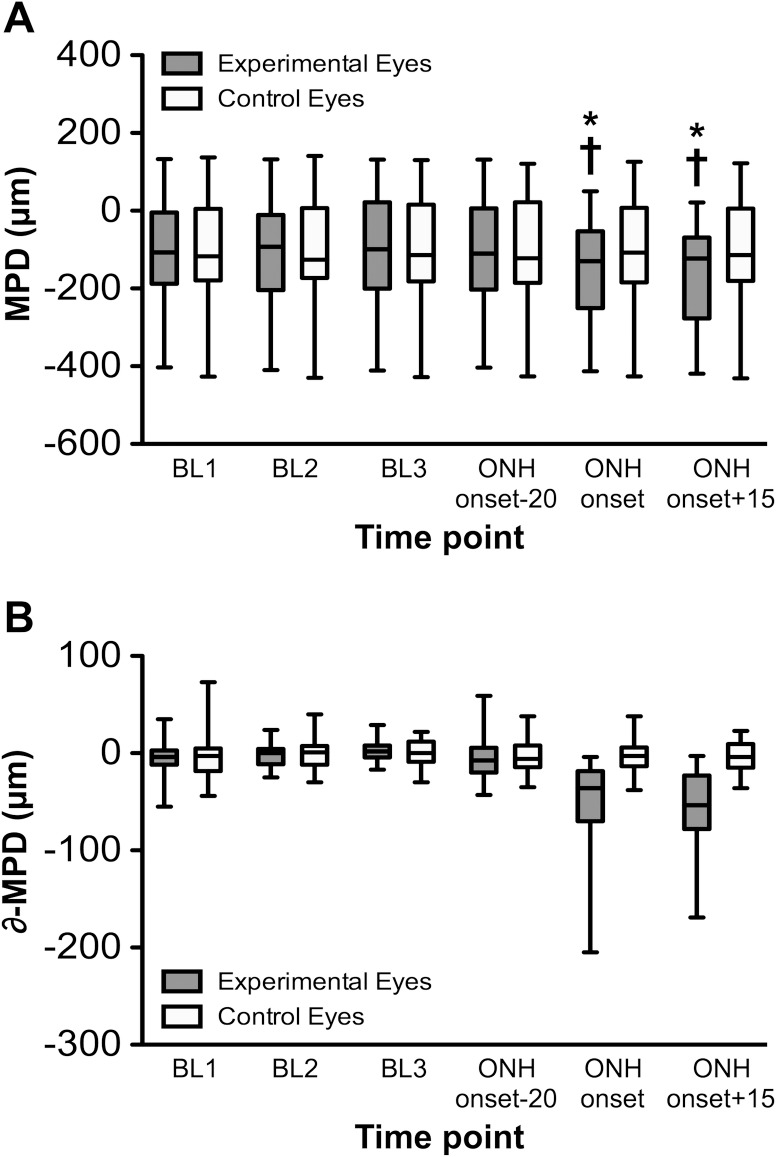
Methods: Thirty-three rhesus macaques had three or more weekly baseline measurements in both eyes of ONH surface topography, peripapillary RNFLT, RNFL retardance, and multifocal electroretinography (mfERG). Laser photocoagulation was then applied to the trabecular meshwork of one eye to induce chronic elevation of IOP and weekly recordings continued alternating between ONH surface topography and RNFLT during one week and RNFL retardance and mfERG the next week. Data were pooled for the group at the onset of ONH surface topography change in each EG eye, which was defined as the first date when either the mean position of the disc (MPD) fell below the 95% confidence limit of each eye's individual baseline range and/or when the topographic change analysis (TCA) map was subjectively judged as having demonstrated change, whichever came first. Analysis of variance with post hoc tests corrected for multiple comparisons were used to assess parameter changes.

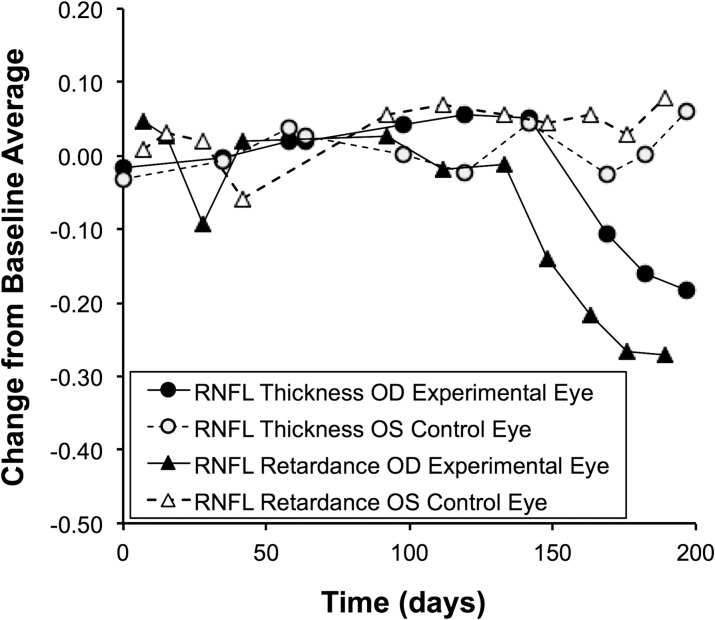
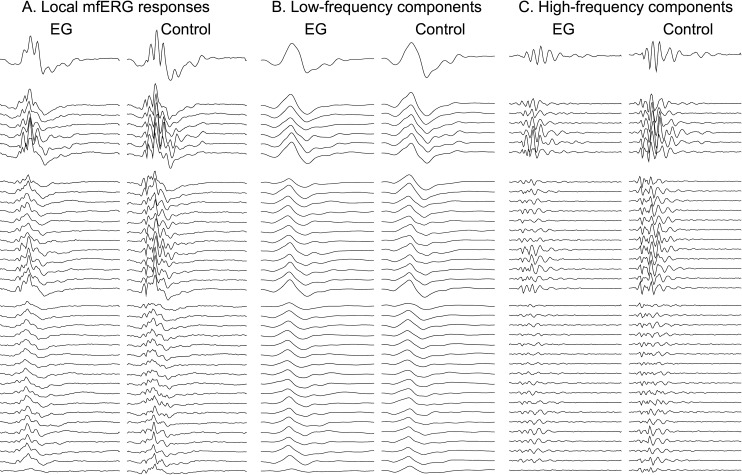
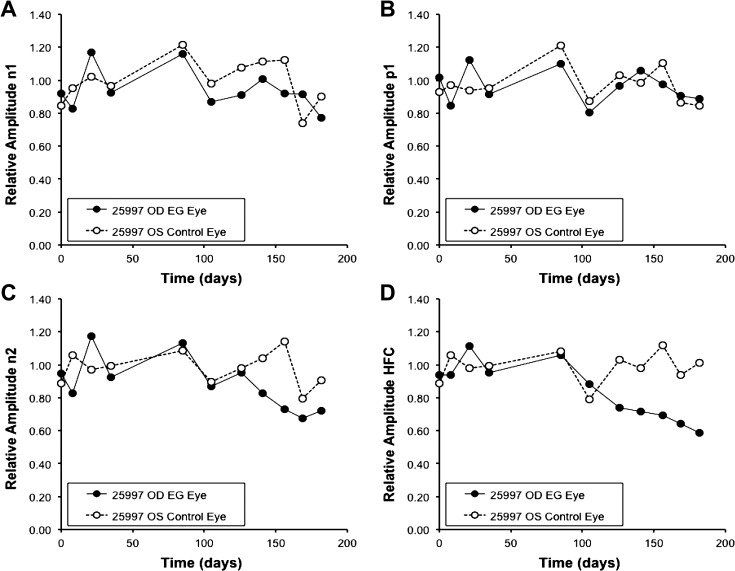
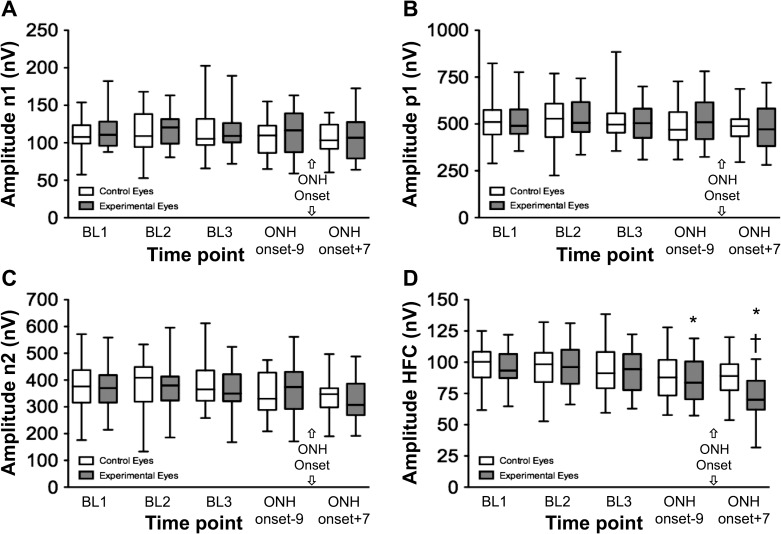
Results: At onset of ONH surface topography change, there was no significant difference for RNFLT versus baseline or fellow control eyes. RNFL retardance and mfERG were significantly reduced in the recordings just prior (median of 9 days) to ONH onset (P < 0.01) and had progressed significantly (P < 0.001) an average of 17 days later (median of 7 days after ONH onset). RNFLT did not exhibit significant thinning until 15 days after onset of ONH surface topography change (P < 0.001).

Conclusions: These results support the hypothesis that during the course of glaucomatous neurodegeneration, axonal cytoskeletal and retinal ganglion cell functional abnormalities exist before thinning of peripapillary RNFL axon bundles begins.


Conflict of interest statement

Disclosure: B. Fortune, Carl Zeiss Meditec Inc. (F), Heidelberg Engineering, GmbH (F); C.F. Burgoyne, Heidelberg Engineering, GmbH (F); G.A. Cull, None; J. Reynaud, None; L. Wang, None

Figures

Figure 1.
Figure 1.
Example of experimental time course for a single representative animal. (A) IOP versus time. Green arrows indicate dates of trabecular meshwork laser photocoagulation. (B) ONH surface topography over time, with TCA showing significant posterior (red pixels) and anterior (green pixels) deformation as compared with baseline (BL). (C) The CSLT parameter MPD versus time.
Figure 2.
Figure 2.
(A) The CSLT parameter MPD versus time for entire group. Box plots represent distribution of MPD values (median, interquartile range, and extremes) for the three BL sessions as well as the session where ONH surface topography onset occurred for each EG eye and the next nearest session prior to and after ONH surface topography onset (which occurred a median of 20 days prior and 15 days after ONH surface change onset, respectively). (B) MPD values normalized to the BL average for each eye and plotted as the difference from BL versus time. *P < 0.0001 versus each BL; †P < 0.0001 versus the session just prior to ONH onset (median of 20 days prior).
Figure 3.
Figure 3.
RNFL retardance and thickness versus time for the individual example animal shown in Figure 1. SLP measurements of RNFL retardance and SD-OCT measurements of RNFL thickness are normalized to the baseline average and plotted versus time as change from baseline.
Figure 4.
Figure 4.
Box plots (as in Fig. 2) representing the distribution of raw values at each of the experimental recording sessions. (A) RNFL thickness. (B) Retardance. Values normalized to BL average are plotted in (C) and (D), respectively. (E) RNFL values for EG eyes—expressed relative to fellow control eye of each animal—versus time. For RNFL thickness data: *P < 0.001, versus each BL; †P < 0.05 versus ONH surface topography onset; ‡ P < 0.0001 versus the session prior to ONH onset (median of 20 days prior). For RNFL retardance data: §P < 0.01 versus each BL; #P < 0.0001 versus each BL and the session just prior to ONH onset (median of 9 days prior). (E): *P < 0.01 versus each BL; †P < 0.0001 versus each BL and the session just prior to ONH onset (median of 9 days prior).
Figure 5.
Figure 5.
Multifocal ERG responses from the final recording session of the same individual animal shown in Figures 1 and 3. The first pair of columns (A) shows the local mfERG responses for the EG eye (left) and control eye (right); the middle pair of columns (B) contains the low-frequency components and the rightmost pair of columns (C) contains the high-frequency components filtered from the local responses. The top row of traces represents the response from the central stimulus element; the second group represents the first ring of responses around the center, and so on. These 37 response locations represent the data used to generate the spatially averaged summary parameter as described in the Methods section and shown in Figures 6 and 7.
Figure 6.
Figure 6.
Multifocal ERG response component amplitudes versus time for the same individual example animal shown in Figures 1, 3, and 5. Data are normalized and plotted relative to the baseline average. (A) LFC features N1. (B) P1. (C) N2. (D) HFC.
Figure 7.
Figure 7.
Multifocal ERG response component amplitudes versus time for the entire group. Box plots (as in Fig. 2) representing the distribution of raw values at each of the experimental recording sessions. (A) mfERG LFC features N1. (B) P1. (C) N2. (D) HFC. *P < 0.01 versus each BL. †P < 0.001 versus the session just prior to ONH onset (median of 9 days prior to ONH onset).

References

    1. Hoyt WF, Newman NM. The earliest observable defect in glaucoma?. Lancet. 1972;1:692–693 - PubMed
    1. Hoyt WF, Frisen L, Newman NM. Fundoscopy of nerve fiber layer defects in glaucoma. Invest Ophthalmol. 1973;12:814–829 - PubMed
    1. Sommer A, Katz J, Quigley HA, et al. Clinically detectable nerve fiber atrophy precedes the onset of glaucomatous field loss. Arch Ophthalmol. 1991;109:77–83 - PubMed
    1. Quigley HA, Addicks EM. Quantitative studies of retinal nerve fiber layer defects. Arch Ophthalmol. 1982;100:807–814 - PubMed
    1. Quigley HA. Examination of the retinal nerve fiber layer in the recognition of early glaucoma damage. Trans Am Ophthalmol Soc. 1986;84:920–966 - PMC - PubMed

Publication types