Promyelocytic leukemia protein (PML) regulates endothelial cell network formation and migration in response to tumor necrosis factor α (TNFα) and interferon α (IFNα)
- PMID: 22589541
- PMCID: PMC3390613
- DOI: 10.1074/jbc.M112.340505
Promyelocytic leukemia protein (PML) regulates endothelial cell network formation and migration in response to tumor necrosis factor α (TNFα) and interferon α (IFNα)
Abstract
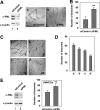
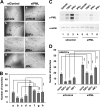
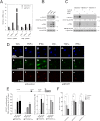
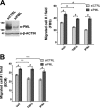
Promyelocytic leukemia protein (PML) is a tumor suppressor that is highly expressed in vascular endothelium and inflamed tissues, yet its role in inflammation-associated cytokine-regulated angiogenesis and underlying mechanism remains largely unclear. We show that tumor necrosis factor α (TNFα) and interferon α (IFNα) stimulate PML expression while suppressing EC network formation and migration, two key events during angiogenesis. By a knockdown approach, we demonstrate that PML is indispensable for TNFα- and IFNα-mediated inhibition of EC network formation. We further demonstrate that signal transducer and activator of transcription 1 (STAT1) binds PML promoter and that is an important regulator of PML expression. Knockdown of STAT1 reduces endogenous PML and blocks TNFα- and IFNα-induced PML accumulation and relieves TNFα- and IFNα-mediated inhibition of EC network formation. Our data also indicate that PML regulates EC migration, in part, by modulating expression of downstream genes, such as negatively regulating integrin β1 (ITGB1). In addition, knockdown of STAT1 or PML alleviates TNFα- and IFNα-mediated inhibition of ITGB1 expression. Antibody blockade demonstrates that ITGB1 is functionally important for PML- and STAT1-regulated EC migration. Taken together, our data provide novel mechanistic insights that PML functions as a negative regulator in EC network formation and migration.
Figures


Similar articles
-
Dual regulation of Stat1 and Stat3 by the tumor suppressor protein PML contributes to interferon α-mediated inhibition of angiogenesis.J Biol Chem. 2017 Jun 16;292(24):10048-10060. doi: 10.1074/jbc.M116.771071. Epub 2017 Apr 21. J Biol Chem. 2017. PMID: 28432122 Free PMC article.
-
Microarray analysis revealing common and distinct functions of promyelocytic leukemia protein (PML) and tumor necrosis factor alpha (TNFα) signaling in endothelial cells.BMC Genomics. 2012 Sep 4;13:453. doi: 10.1186/1471-2164-13-453. BMC Genomics. 2012. PMID: 22947142 Free PMC article.
-
Translational control of PML contributes to TNFα-induced apoptosis of MCF7 breast cancer cells and decreased angiogenesis in HUVECs.Cell Death Differ. 2016 Mar;23(3):469-83. doi: 10.1038/cdd.2015.114. Epub 2015 Sep 18. Cell Death Differ. 2016. PMID: 26383972 Free PMC article.
-
The role of PML ubiquitination in human malignancies.J Biomed Sci. 2012 Aug 30;19(1):81. doi: 10.1186/1423-0127-19-81. J Biomed Sci. 2012. PMID: 22935031 Free PMC article. Review.
-
PML: a tumor suppressor that regulates cell fate in mammary gland.Cell Cycle. 2009 Sep 1;8(17):2711-7. doi: 10.4161/cc.8.17.9462. Epub 2009 Sep 8. Cell Cycle. 2009. PMID: 19652541 Review.
Cited by
-
Differentially Expressed Gene Pathways in the Conjunctiva of Sjögren Syndrome Keratoconjunctivitis Sicca.Front Immunol. 2021 Jul 19;12:702755. doi: 10.3389/fimmu.2021.702755. eCollection 2021. Front Immunol. 2021. PMID: 34349764 Free PMC article.
-
Regulators of TNFα mediated insulin resistance elucidated by quantitative proteomics.Sci Rep. 2020 Nov 30;10(1):20878. doi: 10.1038/s41598-020-77914-1. Sci Rep. 2020. PMID: 33257747 Free PMC article.
-
Dual regulation of Stat1 and Stat3 by the tumor suppressor protein PML contributes to interferon α-mediated inhibition of angiogenesis.J Biol Chem. 2017 Jun 16;292(24):10048-10060. doi: 10.1074/jbc.M116.771071. Epub 2017 Apr 21. J Biol Chem. 2017. PMID: 28432122 Free PMC article.
-
Immunomodulatory and antitumor effects of type I interferons and their application in cancer therapy.Oncotarget. 2017 Jul 25;8(41):71249-71284. doi: 10.18632/oncotarget.19531. eCollection 2017 Sep 19. Oncotarget. 2017. PMID: 29050360 Free PMC article. Review.
-
The epigenetic regulator UHRF1 promotes ubiquitination-mediated degradation of the tumor-suppressor protein promyelocytic leukemia protein.Oncogene. 2013 Aug 15;32(33):3819-28. doi: 10.1038/onc.2012.406. Epub 2012 Sep 3. Oncogene. 2013. PMID: 22945642 Free PMC article.
References
-
- Crowder C., Dahle Ø., Davis R. E., Gabrielsen O. S., Rudikoff S. (2005) PML mediates IFN-α-induced apoptosis in myeloma by regulating TRAIL induction. Blood 105, 1280–1287 - PubMed
-
- Kakizuka A., Miller W. H., Jr., Umesono K., Warrell R. P., Jr., Frankel S. R., Murty V. V., Dmitrovsky E., Evans R. M. (1991) Chromosomal translocation t(15;17) in human acute promyelocytic leukemia fuses RARα with a novel putative transcription factor, PML. Cell 66, 663–674 - PubMed
-
- de Thé H., Lavau C., Marchio A., Chomienne C., Degos L., Dejean A. (1991) The PML-RARα fusion mRNA generated by the t(15;17) translocation in acute promyelocytic leukemia encodes a functionally altered RAR. Cell 66, 675–684 - PubMed
-
- Everett R. D. (2001) DNA viruses and viral proteins that interact with PML nuclear bodies. Oncogene 20, 7266–7273 - PubMed
-
- Negorev D., Maul G. G. (2001) Cellular proteins localized at and interacting within ND10/PML nuclear bodies/PODs suggest functions of a nuclear depot. Oncogene 20, 7234–7242 - PubMed
Publication types
MeSH terms
Substances
Associated data
- Actions
Grants and funding
LinkOut - more resources
Full Text Sources
Molecular Biology Databases
Research Materials
Miscellaneous

