. 2012:7:259-69.
doi: 10.2147/COPD.S30399. Epub 2012 Apr 11.

Dynamic change in respiratory resistance during inspiratory and expiratory phases of tidal breathing in patients with chronic obstructive pulmonary disease

Affiliations

Dynamic change in respiratory resistance during inspiratory and expiratory phases of tidal breathing in patients with chronic obstructive pulmonary disease

Yasuhiro Yamauchi et al. Int J Chron Obstruct Pulmon Dis. 2012.

Abstract

Background and objective: Chronic obstructive pulmonary disease (COPD) is characterized by persistent airflow limitation consisting of airway obstruction and parenchymal emphysema, with loss of elastic recoil. The forced oscillation technique can detect impairment of lung function by measuring lung impedance during normal tidal breathing. Respiratory resistance (Rrs) in COPD has been well-studied, but the differences in Rrs in the inspiratory and expiratory phases between mild and moderate COPD remain poorly understood. Since airway obstruction in COPD is known to change dynamically during tidal breathing and might affect Rrs, the differences in Rrs during tidal breathing between mild and moderate COPD were evaluated.

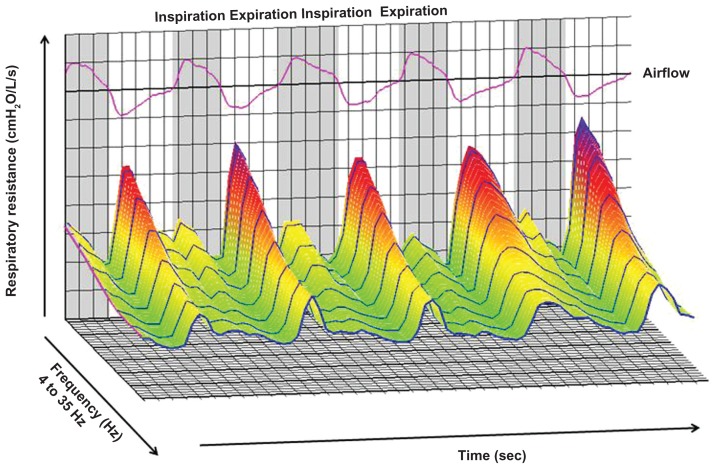
Methods: Mild (n = 13) and moderate (n = 13) COPD patients were recruited at Tokyo University Hospital (Tokyo, Japan). Rrs was measured using MostGraph-01 (Chest MI, Inc, Tokyo, Japan), which depicted Rrs in a frequency-and respiratory cycle-dependent manner in three-dimensional graphics. Rrs was evaluated at 4-35 Hz during tidal breathing.

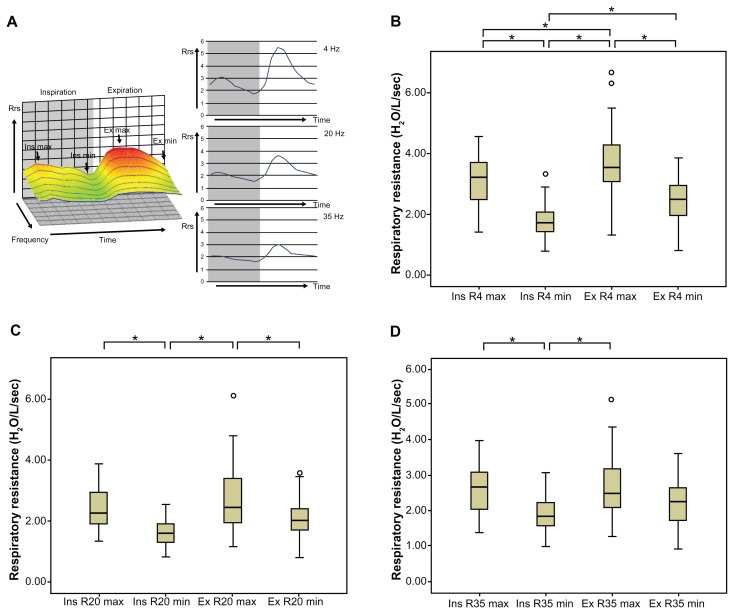
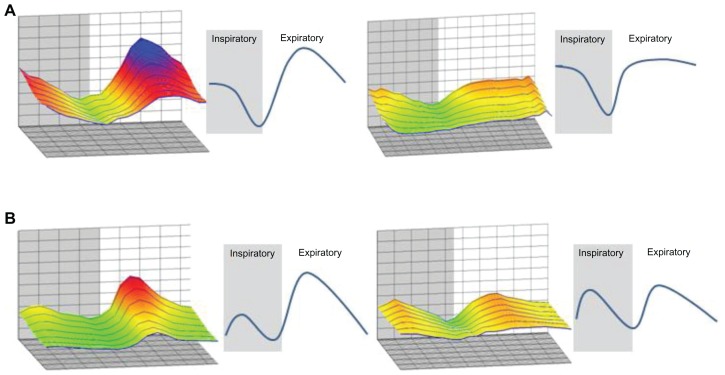
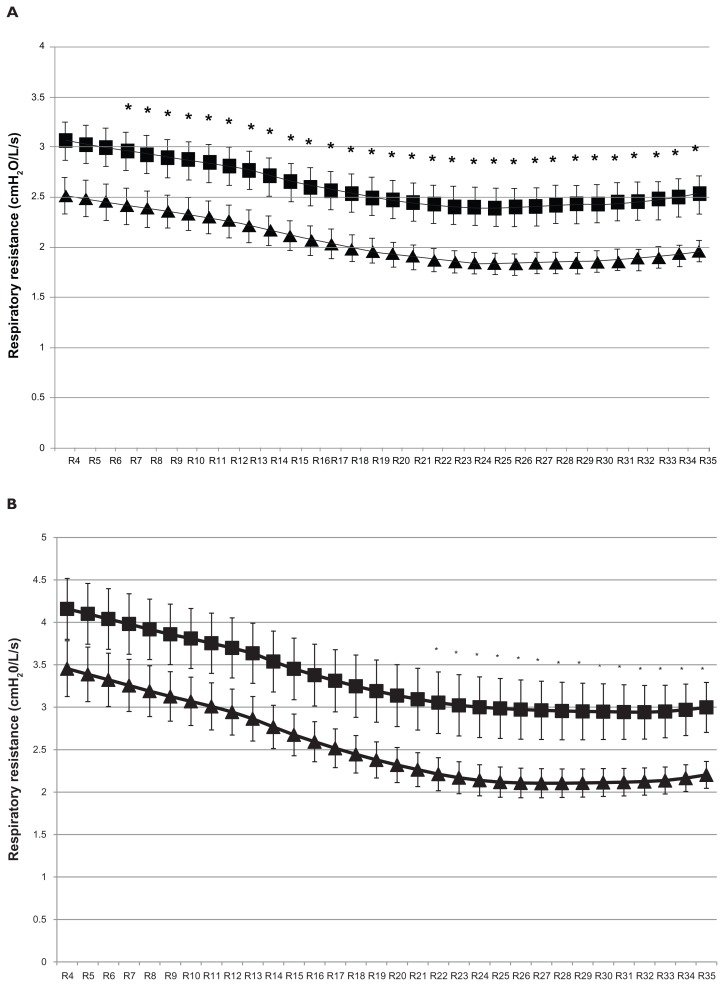
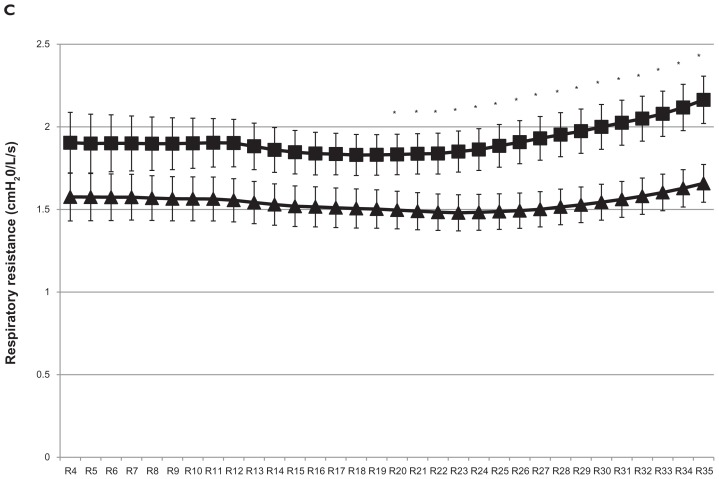
Results: Rrs changed dynamically during tidal breathing in COPD. The mean Rrs values were significantly greater in the moderate COPD group than in the mild group. The maximal and minimal Rrs values at higher frequencies in the respiratory cycle were significantly greater in moderate COPD. In inspiratory-expiratory breath analysis, the maximal and minimal Rrs values at 20 Hz and 35 Hz were significantly greater in the moderate group, whereas at 4 Hz they did not differ significantly between the groups.

Conclusion: Rrs changed dynamically during tidal breathing in patients with COPD. The Rrs values at higher frequencies were greater in moderate COPD than in mild COPD. Rrs at higher frequencies might reflect the degree of airway obstruction in tidal breathing in patients with COPD and might be a useful marker for evaluation of airway obstruction at an early stage of COPD.

Keywords: COPD; airflow limitation; forced oscillation technique; respiratory resistance.


Figures

Figure 1
Figure 1
Representative sample of respiratory resistance in a three-dimensional graphic generated by MostGraph-01 (Chest MI, Inc, Tokyo, Japan). The X-axis shows the frequency from 4 Hz to 35 Hz, the Y-axis shows respiratory resistance, and the Z-axis shows the timecourse. The inspiratory and expiratory phases were based on the airflow of the subjects. The image was created based on the measured results for respiratory impedance.
Figure 2
Figure 2
Comparison of respiratory resistance between the maximal and minimal values in the inspiratory and expiratory phases in chronic obstructive pulmonary disease. (A) Left panel: maximal and minimal respiratory resistance in the inspiratory and expiratory phases in a representative three-dimensional graphic image, created by MostGraph-01 (Chest MI, Inc, Tokyo, Japan), in patients with chronic obstructive pulmonary disease. Right panel: upper, middle, and lower panels show the changes in respiratory resistance at 4 Hz, 20 Hz, and 35 Hz, respectively, during the respiratory cycle. Comparison of the maximal and minimal respiratory resistance values at (B) 4 Hz, (C) 20 Hz, and (D) 35 Hz during the respiratory cycle are also shown. Notes: Comparison of respiratory resistance between the inspiratory and expiratory phases was performed by one-way analysis of variance followed by multiple comparisons using the Bonferroni method. *P < 0.05 for each group. Abbreviations: ex max, maximal value in the expiratory phase; ex min, minimal value in the expiratory phase; ins max, maximal value in the inspiratory phase; ins min, minimal value in the inspiratory phase; Rrs, respiratory resistance; R4, respiratory resistance at 4 Hz; R20, respiratory resistance at 20 Hz; R35, respiratory resistance at 35 Hz.
Figure 3
Figure 3
Patterns of change in respiratory resistance during tidal breathing in patients with chronic obstructive pulmonary disease. Respiratory resistance in three-dimensional graphics generated by MostGraph-01 (Chest MI, Inc, Tokyo, Japan) for patients with chronic obstructive pulmonary disease changed dynamically. Based on respiratory resistance at 4 Hz, the changes were classified into two patterns: (A) the sinusoidal pattern, which consisted of one peak and one valley in each respiratory cycle, and (B) the bimodal pattern, which consisted of two peaks and two valleys in each respiratory cycle.
Figure 4
Figure 4
Comparison of respiratory resistance at 4–35 Hz in whole-breath between mild (▴) and moderate (■) chronic obstructive pulmonary disease. Comparison of whole-breath (A) mean respiratory resistance, (B) maximal respiratory resistance, and (C) minimal respiratory resistance are shown. Note: Comparisons between two groups were performed using Student’s t-test. *P < 0.05. X-axis represents respiratory resistance at 4–35 Hz (ie, R4–R35).
Figure 4
Figure 4
Comparison of respiratory resistance at 4–35 Hz in whole-breath between mild (▴) and moderate (■) chronic obstructive pulmonary disease. Comparison of whole-breath (A) mean respiratory resistance, (B) maximal respiratory resistance, and (C) minimal respiratory resistance are shown. Note: Comparisons between two groups were performed using Student’s t-test. *P < 0.05. X-axis represents respiratory resistance at 4–35 Hz (ie, R4–R35).

References

    1. Rabe KF, Hurd S, Anzueto A, et al. Global strategy for the diagnosis, management, and prevention of chronic obstructive pulmonary disease: GOLD executive summary. Am J Respir Crit Care Med. 2007;176(6):532–555. - PubMed
    1. Oostveen E, MacLeod D, Lorino H, et al. The forced oscillation technique in clinical practice: methodology, recommendations and future developments. Eur Respir J. 2003;22(6):1026–1041. - PubMed
    1. LaPrad AS, Lutchen KR. Respiratory impedance measurements for assessment of lung mechanics: focus on asthma. Respir Physiol Neurobiol. 2008;163(1–3):64–73. - PMC - PubMed
    1. Goldman MD. Clinical application of forced oscillation. Pulm Pharmacol Ther. 2001;14(5):341–350. - PubMed
    1. Grimby G, Takishima T, Graham W, Macklem P, Mead J. Frequency dependence of flow resistance in patients with obstructive lung disease. J Clin Invest. 1968;47(6):1455–1465. - PMC - PubMed

Publication types

MeSH terms