. 2012;8(5):e1002679.
doi: 10.1371/journal.ppat.1002679. Epub 2012 May 10.

Entry of herpes simplex virus type 1 (HSV-1) into the distal axons of trigeminal neurons favors the onset of nonproductive, silent infection

Affiliations

Entry of herpes simplex virus type 1 (HSV-1) into the distal axons of trigeminal neurons favors the onset of nonproductive, silent infection

Wali Hafezi et al. PLoS Pathog. 2012.

Abstract

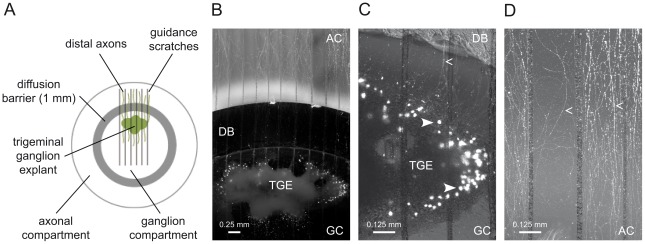
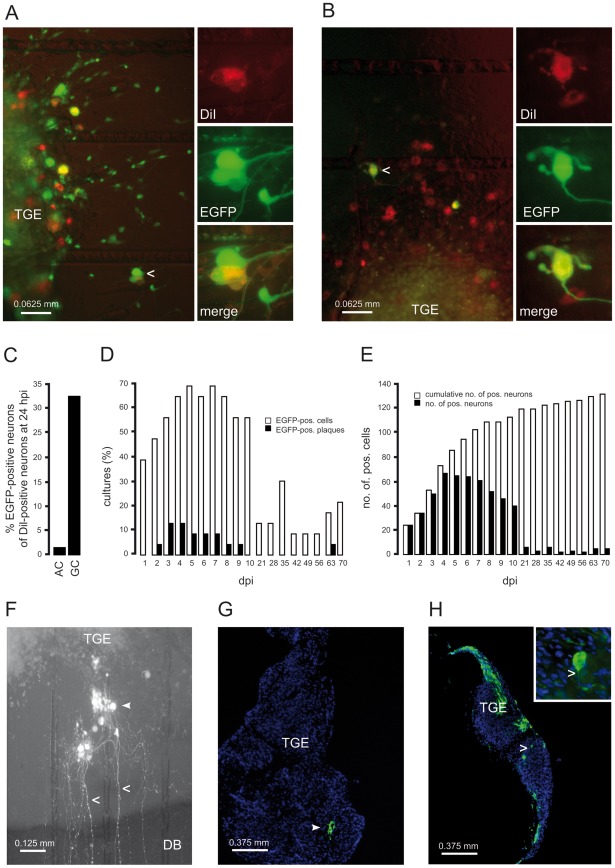
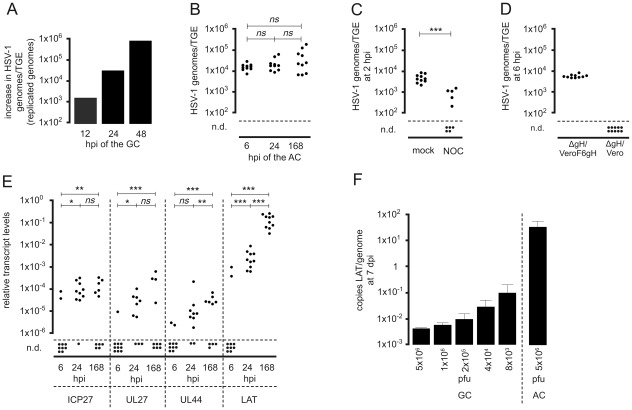
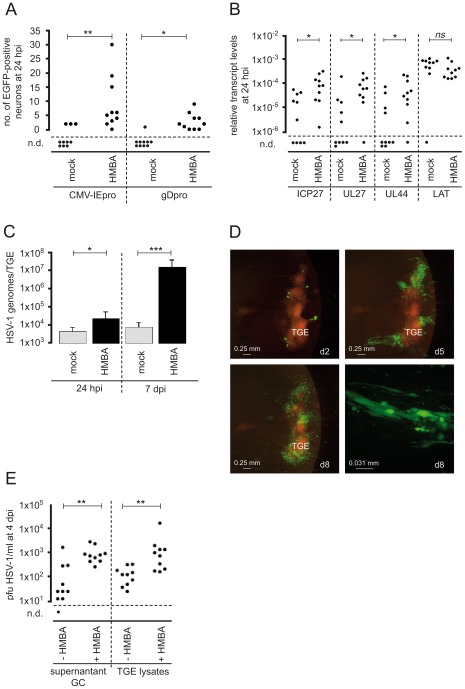
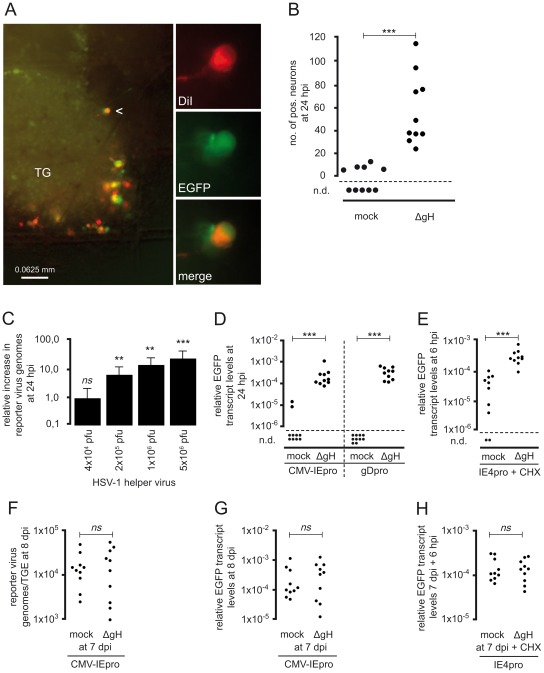
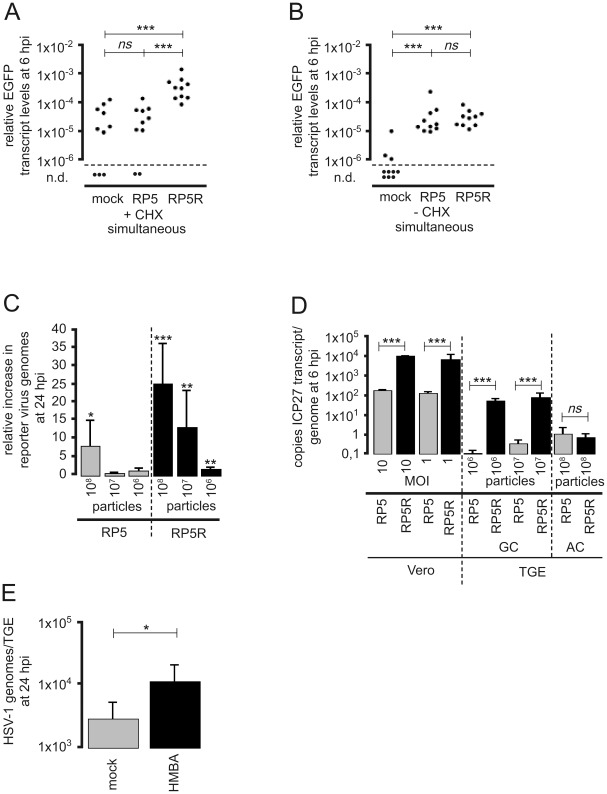
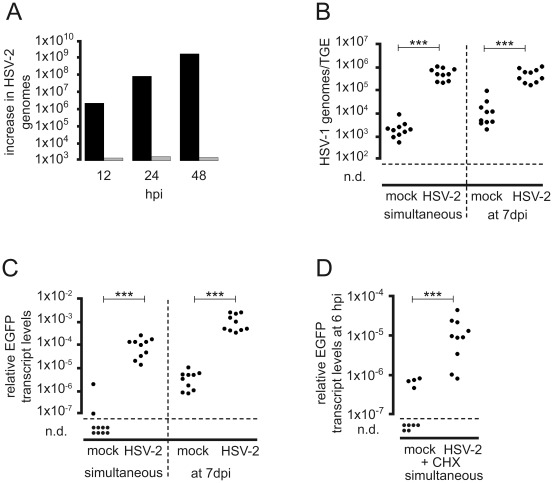
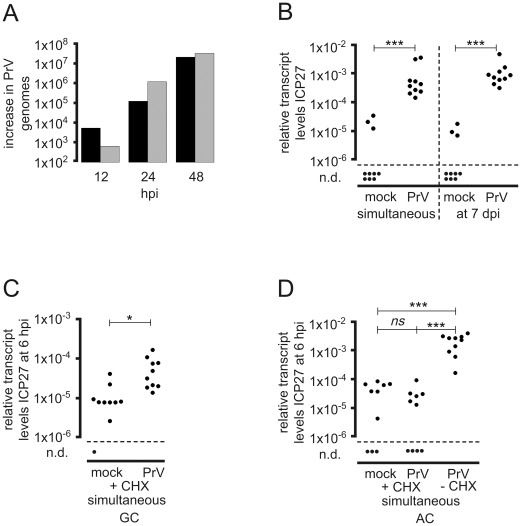
Following productive, lytic infection in epithelia, herpes simplex virus type 1 (HSV-1) establishes a lifelong latent infection in sensory neurons that is interrupted by episodes of reactivation. In order to better understand what triggers this lytic/latent decision in neurons, we set up an organotypic model based on chicken embryonic trigeminal ganglia explants (TGEs) in a double chamber system. Adding HSV-1 to the ganglion compartment (GC) resulted in a productive infection in the explants. By contrast, selective application of the virus to distal axons led to a largely nonproductive infection that was characterized by the poor expression of lytic genes and the presence of high levels of the 2.0-kb major latency-associated transcript (LAT) RNA. Treatment of the explants with the immediate-early (IE) gene transcriptional inducer hexamethylene bisacetamide, and simultaneous co-infection of the GC with HSV-1, herpes simplex virus type 2 (HSV-2) or pseudorabies virus (PrV) helper virus significantly enhanced the ability of HSV-1 to productively infect sensory neurons upon axonal entry. Helper-virus-induced transactivation of HSV-1 IE gene expression in axonally-infected TGEs in the absence of de novo protein synthesis was dependent on the presence of functional tegument protein VP16 in HSV-1 helper virus particles. After the establishment of a LAT-positive silent infection in TGEs, HSV-1 was refractory to transactivation by superinfection of the GC with HSV-1 but not with HSV-2 and PrV helper virus. In conclusion, the site of entry appears to be a critical determinant in the lytic/latent decision in sensory neurons. HSV-1 entry into distal axons results in an insufficient transactivation of IE gene expression and favors the establishment of a nonproductive, silent infection in trigeminal neurons.


Conflict of interest statement

The authors have declared that no competing interests exist.

Figures

Figure 1
Figure 1. Trigeminal ganglion explant cultures.
(A) Scheme of the double chamber system. (B–D) Trigeminal ganglion explant (TGE) cultures stained with DiI in the axonal compartment (AC) 48 h before imaging: (B) overview and (C, D) typical DiI-positive neurons (solid arrowheads) and neurites (arrowheads) in the ganglion compartment (GC) and AC shown at higher magnification. DB, diffusion barrier.
Figure 2
Figure 2. Protein expression and spread of HSV-1 in infected TGEs.
(A) Infection of the GC with HSV-1 17 CMV-IEproEGFP. TGEs were infected with 1×10⁶ pfu, and stained in the AC with DiI at 1 hpi. At 24 hpi, DiI-specific (A, top right) and EGFP-specific (A, middle right) fluorescence was monitored in intact cultures. The arrowhead indicates a typical EGFP-expressing, DiI-positive neuron depicted at higher magnification at the right margin. A merged image of DiI- and EGFP-specific fluorescence is also shown (A, bottom right). (B) Infection of the AC with HSV-1 17 CMV-IEproEGFP. EGFP expression in single neurons at 48 hpi with HSV-1 17 CMV-IEproEGFP. TGEs were infected in the AC with 5×10⁶ pfu and stained with DiI at 1 hpi. A typical EGFP- and DiI-positive neuron is indicated by an arrowhead and depicted at higher magnification in the right-hand image. (C) Percentages of DiI/EGFP-double positive neurons. TGEs were either infected in the GC or in the AC with HSV-1 17 CMV-IEproEGFP and co-stained with DiI as given in (A,B). At 24 hpi, the numbers of EGFP and DiI-positive neurons in intact TGEs were determined microscopically. (D) Percentages of TGEs containing EGFP-positive (pos.) cells (white bars) and plaque-like clusters of EGFP-positive cells (EGFP-pos. plaques) (black bars). TGEs (n = 23) were axonally-infected with 5×10⁶ pfu of HSV-1 17 CMV-IEproEGFP and monitored daily from 1 to 10 dpi, and from 3 to 10 wpi. (E) Time kinetics of EGFP expression in neurons. Reporter gene expression in the TGEs shown in (D) was documented photographically at the time points indicated. Individual EGFP-positive neurons were identified, and the total (black bars) and cumulative (white bars) numbers of EGFP-positive neurons were determined. (F) Plaque-like cluster of EGFP-positive cells in an axonally-infected TGE at 5 dpi. EGFP-positive cells (triangle) and typical, EGFP-positive neurites (arrow heads) are indicated. (G) Detection of HSV-1-positive cells in cryosections of infected TGEs. TGEs were infected in the AC with 5×10⁶ pfu of HSV-1 17syn+. HSV-1-positive cells were detected at 2 dpi by immunofluorescence using a polyclonal antibody against HSV-1 (green), nuclei were stained with 4′,6-diamidino-2-phenylindole (blue). (H) TGEs were infected in the GC with 104 pfu of HSV-1 17syn+, and cultures were fixed and stained at 2 dpi, as given above. A typical HSV-1-positive neuron is shown at higher magnification in the inset image; the neurite is indicated by the arrowhead.
Figure 3
Figure 3. Genome and transcript levels in HSV-1-infected TGEs.
(A) Replication of HSV-1 17syn+ in TGEs infected in the GC. Groups of three TGEs were infected in the GC with 1×10⁴ pfu of HSV-1 17syn+. TGEs were harvested at the time points indicated. DNA extracts were pooled, genome levels per TGE were quantified by qPCR, and the increase in genome levels relative to that at 1 hpi was determined (replicated genomes). (B) Genome levels in TGEs infected in the AC with HSV-1 17syn+. Groups of ten cultures, each containing two TGEs, were infected with 5×10⁶ pfu of HSV-1 17syn+, TGEs of individual cultures were pooled and genome levels/TGE were determined by qPCR at the time points indicated, n.d., No viral genomes detected by qPCR. The statistical significances of results are indicated as follows: ns (not significant), P>0.05; *P = 0.005–0.05; **P = 0.0005–0.005; ***P<0.0005. The median genome levels did not differ significantly between 6 hpi and 24 hpi, 24 hpi and 7 dpi, and 6 hpi and 7 dpi (P = 0.393, 0.4813, and 0.2176, respectively; Mann-Whitney test). (C) Effect of nocodazole on the axonal transport of viral particles. Cultures were infected in the AC with 5×10⁶ pfu of HSV-1 17syn+ in the presence of 10 µM nocodazole (NOC); mock-treated cultures served as controls. TGEs were harvested at 2 hpi, and genome levels were determined by qPCR, n.d., No viral genomes detected by qPCR. Differences in genome levels between NOC-treated and untreated cultures at 2 hpi were highly significant (P = 0.0002; unpaired t test with Welch correction). (D) Infection of the AC with the fusion-deficient, gH-negative mutant HSV-1 KOSgH87. Infection of the AC was performed with 1×10⁸ particles of HSV-1 KOSgH87. The virus was purified using a saccharose gradient from the supernatants of transcomplementing VeroF6gH cells (ΔgH/VeroF6gH) (corresponding to 5×10⁶ pfu on VeroF6gH cells) and of noncomplementing Vero cells (ΔgH/Vero) (corresponding to 10 pfu on VeroF6gH cells). Genome levels were determined by qPCR at 6 hpi. (E) Transcript levels in TGEs axonally-infected with HSV-1 17syn+. Groups of ten cultures, each containing two TGEs, were infected in the AC with 5×10⁶ pfu. IE (ICP27), E/L (UL27), L (UL44), and LAT transcripts were quantified by RT-PCR and normalized to β-actin transcript levels. Transcript levels at 6, 24, and 168 hpi (7 dpi) are shown, n.d., No viral transcripts detected. The statistical significances of differences in median transcript levels between 6 and 24 hpi, 24 and 168 hpi, and 6 and 168 hpi are indicated (ICP27: P = 0.0068, 0.8798, and 0.0011, respectively; UL27: P = 0.0433, 0.1124, and 0.0001, respectively; UL44: P = 0.1230, 0.0021, and <0.0001, respectively; LAT: P<0.0001, <0.0001, and <0.0001, respectively; Mann-Whitney test). (F) Specific transcriptional activity of the LAT gene in TGEs infected in the GC and AC, respectively. Groups of four TGEs were infected in the GC with different infectious doses of HSV-1 17syn+ as indicated. A group of ten TGEs was infected in the AC with 5×10⁶ pfu. At 7 dpi, LAT copies and viral genomes/TGE were quantitated by qPCR, and the mean ratio of LAT copies/HSV-1 genomes was determined. Data are mean and SD values.
Figure 4
Figure 4. Stimulation of productive HSV-1 infection by HMBA.
(A) EGFP expression in neurons in the AC at 24 hpi with 5×10⁶ pfu of HSV-1 17 CMV-IEproEGFP and HSV-1 17 gDproEGFP in the presence of 2.5 mM HMBA. Mock-treated cultures are shown as controls. n.d., No EGFP-positive neurons detected. The statistical significances of variations in the median number of EGFP-positive neurons in HMBA-treated cultures relative to mock-treated cultures are indicated (HSV-1 17 CMV-IEproEGFP, P = 0.0017; HSV-1 17 gDproEGFP, P = 0.0132; Mann-Whitney test). (B) Effect of HMBA on HSV-1 transcript levels in axonally-infected TGEs at 24 hpi. TGEs were infected in the AC with 5×10⁶ pfu of HSV-1 17 gDproEGFP. The statistical significances of differences in median transcript levels are indicated (ICP27, P = 0.0089; UL27, P = 0.0185; UL44, P = 0.0355; LAT, P = 0.1051; Mann-Whitney test). (C) Effect of HMBA on HSV-1 genome levels in axonally-infected TGEs. Groups of ten TGEs were infected in the AC with 5×10⁶ pfu of HSV-1 17 gDproEGFP in the presence of 2.5 mM HMBA; mock-treated cultures served as controls. Genome levels were determined by qPCR at 24 hpi and 7 dpi. The statistical significances of differences in median genome levels are indicated (24 hpi, P = 0.0115; 7 dpi, P = 0.0002; Mann-Whitney test). Data are mean and SD values. (D) Spread of HSV-1 in axonally-infected TGEs in the presence of HMBA. TGEs were infected in the AC with 5×10⁶ pfu of HSV-1 17 gDproEGFP in the presence of 2.5 mM HMBA and monitored daily for EGFP expression. The pattern of fluorescence in a culture with massive viral spread is shown at 2, 5, and 8 dpi (d2, d5, and d8, respectively). The bottom-right image depicts a group of HSV-1 infected nonneuronal cells at 8 dpi. (E) Effect of HMBA on the release of cell free virus. TGEs were infected in the GC with 1×10⁴ pfu of HSV-1 17 gDproEGFP in the presence or absence of 2.5 mM HMBA as indicated in culture medium without CMC and HSV-1 antiserum. At 4 dpi, supernatants (supernatant GC) and TGEs were harvested and virus was titrated. Infectious virus was liberated from TGEs by repeated freeze-thawing in 100 µl PBS (TGE lysates).
Figure 5
Figure 5. Transactivation of HSV-1 in axonally-infected TGEs by infection of the GC with HSV-1 helper virus.
(A) Effect of helper virus on EGFP expression in TGEs infected in the AC with HSV-1 17 CMV-IEproEGFP. TGEs were co-infected with 1×10⁶ pfu of the gH-negative, spread-deficient mutant HSV-1 KOS gH87 in the GC and 5×10⁶ pfu of HSV-1 17 CMV-IEproEGFP in the AC. At 1 hpi, cultures were stained with DiI in the AC. The arrowhead indicates a typical DiI and EGFP double-positive neuron depicted at higher magnification in the right-hand images. (B) Effect of helper virus on EGFP expression in axonally-infected neurons. The numbers of positive neurons/culture infected in the AC with 5×10⁶ pfu of HSV-1 17 CMVpro-IE EGFP and co-infected in the GC with 5×10⁶ pfu of HSV-1 KOS gH87 (ΔgH) or mock-infected are given. Differences were highly significant (P = 0.0003, unpaired t test with Welch correction). (C) Effect of helper virus on genome replication of HSV-1 after infection of the AC. Groups of ten cultures were infected in the AC with 5×10⁶ pfu of HSV-1 17 CMV-IEproEGFP. The GC was co-infected with varying amounts of HSV-1 KOS gH87, as indicated. TGEs were harvested at 24 hpi with the helper virus, reporter virus genome levels were quantified by qPCR, and the increase of reporter virus genome levels relative to controls was calculated. The significances of helper-virus-induced increases in the median genome level of reporter virus genomes are indicated (5×10⁶ pfu helper virus, P<0.0001; 1×10⁶ pfu helper virus, P = 0.0021; 2×10⁵ pfu helper virus, P = 0.0015; 4×10⁴ pfu helper virus, P = 0.4359; Mann-Whitney test). Data are mean and SD values. (D) Reporter gene expression 24 h after co-infection of the GC with HSV-1 helper virus. Cultures were infected with 5×10⁶ pfu of HSV-1 17 CMV-IEproEGFP, and HSV-1 17 gDproEGFP in the AC. Groups of ten cultures were co-infected with 5×10⁶ pfu of HSV-1 KOS gH87 in the GC; cultures not infected with helper virus served as controls. The significances of differences in the relative transcript levels are indicated (HSV-1 CMV-IEpro EGFP, P<0.0001; HSV-1 gDproEGFP, P<0.0001; unpaired t test with Welch correction). (E) Helper-virus-induced transcriptional transactivation of IE gene expression in the absence of de novo protein synthesis. Cultures were infected in the AC with 5×10⁶ pfu of HSV-1 17 IE4proEGFP in the presence of 50 µg/ml CHX. Groups of ten cultures were co-infected in the GC with 5×10⁶ pfu of HSV-1 KOS gH87; cultures without helper-virus co-infection served as controls. TGEs were harvested in the AC at 6 hpi and the relative transcript levels of EGFP were determined. The statistical significances of differences are indicated (P = 0.0003; unpaired t test with Welch correction). (F–H) Effect of HSV helper virus added to the GC of the AC at 7 dpi. (F, G) Cultures were infected in the AC with 5×10⁶ pfu of HSV-1 17 CMV-IEproEGFP. At 7 dpi, cultures were infected in the GC with 5×10⁶ pfu of HSV-1 KOS gH87, cultures without helper-virus infection served as controls. At 24 h after the addition of helper virus, TGEs were harvested and genome levels of the reporter virus (F) and EGFP transcript levels were determined. There were no significant differences in reporter virus genome and transcript levels (genomes, P>0.9999, Mann-Whitney test; transcript levels, P = 0.7609, unpaired t test with Welch correction). (H) Cultures were infected in the AC with 5×10⁶ pfu of HSV-1 17 IE4proEGFP. At 7 dpi, cultures in the AC were either infected in the GC with 5×10⁶ pfu of HSV-1 KOS gH87 or mock-infected in the presence of CHX, and EGFP transcript levels were determined 6 h after addition of the helper virus. There were no significant differences in transcript levels (P = 0.8269, unpaired t test with Welch correction).
Figure 6
Figure 6. Infection of TGEs by the VP16AD-deficient mutant HSV-1 KOS RP5.
(A) Transactivation of HSV-1 IE gene expression by HSV-1 KOS RP5 in the absence of de novo protein synthesis. Cultures were infected in the AC with 5×10⁶ pfu of HSV-1 17 IE4proEGFP in the presence of 50 µg/ml CHX. Groups of ten cultures were co-infected in the GC with identical numbers of particles of HSV-1 KOS RP5 or the revertant HSV-1 KOS RP5R (1×10⁸ particles, corresponding to 5×10⁶ pfu of HSV-1 KOS RP5R). Cultures without helper-virus co-infection served as controls. Cultures were harvested at 6 hpi, and the relative transcript levels of EGFP were determined. The statistical significances of differences in the mean relative transcript levels are indicated (mock vs. HSV-1 KOS RP5, P = 0.8352; mock vs. HSV-1 KOS RP5R, P<0.0001; HSV-1 KOS RP5 vs. HSV-1 KOS RP5R P<0.0001; unpaired t test with Welch correction), ns (not significant). (B) Transactivation of HSV-1 IE gene expression by HSV-1 KOS RP5 without inhibition of de novo protein synthesis. Cultures were infected in the absence of CHX with HSV-1 KOS RP5 and RP5R as given above (Figure 6A) and the relative transcript levels of EGFP were determined at 6 hpi. The statistical significances of differences in the mean relative transcript levels are indicated (mock vs. HSV-1 KOS RP5, P<0.0001; mock vs. HSV-1 KOS RP5R, P<0.0001; HSV-1 KOS RP5 vs. HSV-1 KOS RP5R P = 0.6874; unpaired t test with Welch correction), ns (not significant). (C) Transactivation of HSV-1 genome replication by HSV-1 KOS RP5. Groups of ten cultures were infected in the AC with 5×10⁶ pfu of HSV-1 17 gDproEGFP. The GC was co-infected with different infectious doses of HSV-1 KOS RP5 and RP5R as indicated. TGEs were harvested at 24 hpi with the helper virus, reporter virus genome levels were quantified by qPCR, and the increase of reporter virus genome levels relative to controls was calculated. The significances of helper-virus-induced increases in the mean genome level of reporter virus genomes are indicated (HSV-1 KOS RP5: 1×10⁸ particles, P = 0.0108; 1×10⁷ particles, P = 0.0572; 1×10⁶ particles, P = 0.1592; HSV-1 KOS RP5R: 1×10⁸ particles, P<0.0001; 1×10⁷ particles, P = 0.0038; 1×10⁶ particles, P = 0.0026; unpaired t test with Welch correction). Data are mean and SD values. (D) Specific transcriptional activity of the ICP27 gene in cultures infected with HSV-1 KOS RP5 and RP5R in the absence of de novo protein synthesis. Vero cells (three independent experiments) were infected with an identical number of particles of HSV-1 KOS RP5 and RP5R at the MOI indicated, groups of 4 and 10 CHX-treated TGEs were infected in the GC and AC, respectively, with the number of particles indicated, and harvested at 6 hpi. Copy numbers of the ICP27 transcript and viral genomes/TGE were quantitated by qPCR, and the ratio of ICP27 transcript copies/HSV-1 genomes was determined. The significance of differences in the specific transcriptional activity of ICP27 are indicated (Vero cells: HSV-1 KOS RP5 vs. RP5R infected at a MOI 10 and 1, P = 0.0001; TGEs infected in the GC: HSV-1 KOS RP5 vs. RP5R infected with 106 and 107 particles, P = 0.0001; TGEs infected in the AC: HSV-1 KOS RP5 vs. RP5R, P = 0.3242; unpaired t test with Welch correction). Data are mean and SD values, ns (not significant). (E) Effect of HMBA-treatment on genome levels in TGEs infected in the AC with HSV-1 KOS RP5. Cultures were infected in the AC with 1×10⁸ particles of HSV-1 KOS RP5 in the absence or presence of 2.5 mM HMBA. Genome levels were determined at 24 hpi. The statistical significances of differences in the mean genome level is indicated (P = 0.0363; unpaired t test with Welch correction). Data are mean and SD values.
Figure 7
Figure 7. Transcriptional transactivation of HSV-1 IE gene expression by HSV-2 helper virus.
(A) Replication of HSV-2 in TGEs. Groups of three TGEs were either infected in the AC with 5×10⁶ pfu of HSV-2 333 (grey bars) or in the GC with 104 pfu of HSV-2 333 (black bars), and harvested at the time points indicated. DNA extracts were pooled, genome levels were determined by qPCR, and the increase in genome levels relative to 1 hpi was calculated. (B, C) Transactivation of HSV-1 by HSV-2 infection of the GC. TGEs were infected in the AC with 5×10⁶ pfu of HSV-1 CMV-IEproEGFP, and infected either simultaneously or at 7 dpi in the GC with 5×10⁶ pfu of HSV-2 333. Cultures were harvested at 24 hpi after the addition of HSV-2 to the GC, and HSV-1 genome (B) and relative EGFP transcript levels (C) were determined. Cultures not infected with helper virus served as controls. The statistical significances of differences in the transcript levels are indicated (simultaneous infection, P<0.0001; addition of PrV at 7 dpi, P<0.0001; Mann-Whitney test). (D) Transcriptional transactivation of HSV-1 by co-infection of the GC with HSV-2 in the presence of CHX. TGEs were infected in the AC with 5×10⁶ pfu of HSV-1 17 IE4proEGFP in the presence of CHX and either co-infected in the GC with 5×10⁶ pfu of HSV-2 333 or mock-treated. Cultures were harvested at 6 hpi and EGFP transcript levels normalized to β-actin transcripts were determined. The statistical significances of differences in the mean relative transcript levels are indicated (P>0.0001, unpaired t-test with Welch correction).
Figure 8
Figure 8. Transcriptional transactivation of HSV-1 IE gene expression by PrV helper virus.
(A) Replication of PrV in TGEs. Groups of three TGEs were either infected in the AC with 5×10⁶ pfu of PrV-KaDgGgfp (grey bars) or in the GC with 104 pfu of PrV-KaDgGgfp (black bars), and harvested at the time points indicated. DNA extracts were pooled, genome levels were determined by qPCR, and the increase in genome levels relative to 1 hpi was calculated. (B) Transcriptional transactivation of HSV-1 by PrV infection of the GC. TGEs were infected in the AC with 5×10⁶ pfu of HSV-1 CMV-IEproEGFP, and infected either simultaneously or at 7 dpi in the GC with 5×10⁶ pfu of PrV-KaDgGgfp. Replication of PrV was suppressed by the addition of 50 µg/ml ACV to the media. Cultures were harvested at 6 hpi after the addition of PrV to the GC, and relative ICP27 transcript levels were determined. Cultures not infected with helper virus served as controls. The statistical significances of differences in the transcript levels are indicated (simultaneous infection, P<0.0001; addition of PrV at 7 dpi, P<0.0001; unpaired t test with Welch correction). (C) Transcriptional transactivation of HSV-1 by co-infection of the GC with PrV in the presence of CHX. TGEs were infected in the AC with 5×10⁶ pfu of HSV-1 17 CMV-IEproEGFP in the presence of CHX and either co-infected in the GC with 5×10⁶ pfu of PrV-KaΔgGgfp or mock-treated. Cultures were harvested at 6 hpi and ICP27 transcript levels normalized to β-actin transcripts were determined. The statistical significances of differences in the mean relative transcript levels are indicated (P = 0.0186, unpaired t test with Welch correction). (D) Transcriptional transactivation of HSV-1 by co-infection of the AC with PrV. TGEs were infected in the AC with 2.5×10⁶ pfu of HSV-1 17 syn+ in the presence or absence of CHX and co-infected in the AC with 2.5×10⁶ pfu of PrV-KaΔgGgfp or mock-treated as indicated. Cultures were harvested at 6 hpi and ICP27 transcript levels normalized to β-actin transcripts were determined. The statistical significances of differences in the mean relative transcript levels are indicated (mock+CHX vs. PrV+CHX, P>0.999; mock+CHX vs. PrV−CHX, P<0.0001; PrV+CHX vs. PrV−CHX, P<0.0001; Mann-Whitney test), ns (not significant).

References

    1. Pellet PE, Roizman B. The familiy herpesviridae: A brief introduction. In: Fields BN, Knipe DM, Howley PM, editors. Fields Virology. 5 ed. New York, NY: Lippincott, Williams & Wilkins; 2007. pp. 2479–2500.
    1. Roizman B, Knipe DM, Whitley RJ. Herpes simplex viruses. In: Fields BN, Knipe DM, Howley PM, editors. Fields Virology. 5 ed. New York, NY: Lippincott, Williams & Wilkins; 2007. pp. 2501–2601.
    1. Diefenbach RJ, Miranda-Saksena M, Douglas MW, Cunningham AL. Transport and egress of herpes simplex virus in neurons. Rev Med Virol. 2008;18:35–51. - PubMed
    1. Perng GC, Jones C. Towards an understanding of the herpes simplex virus type 1 latency-reactivation cycle. Interdiscip Perspect Infect Dis. 2010;2010:262415. - PMC - PubMed
    1. Preston CM, Efstathiou S. Molecular basis of HSV latency and reactivation. In: Arvin A, Campadelli-Fiume G, Mocarski E, Moore PS, Roizman B, et al., editors. Human Herpesviruses : Biology, Therapy, and Immunoprophylaxis. Cambridge: Cambridge University Press, PMID: 21348106; 2007. - PubMed

Publication types