. 2012;8(5):e1002691.
doi: 10.1371/journal.pgen.1002691. Epub 2012 May 10.

Histone h1 depletion impairs embryonic stem cell differentiation

Affiliations

Histone h1 depletion impairs embryonic stem cell differentiation

Yunzhe Zhang et al. PLoS Genet. 2012.

Abstract

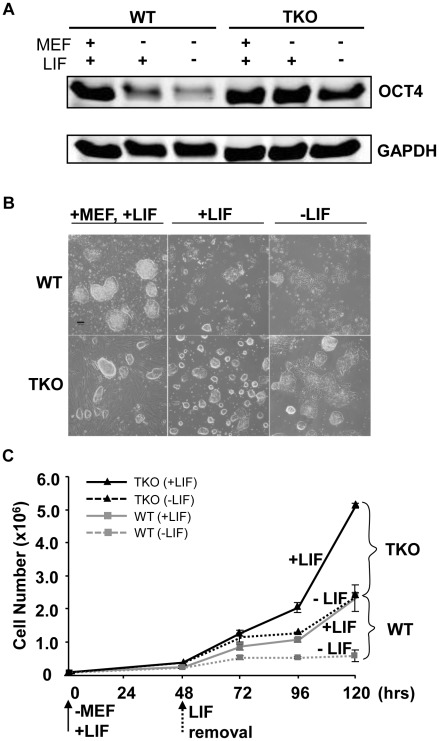
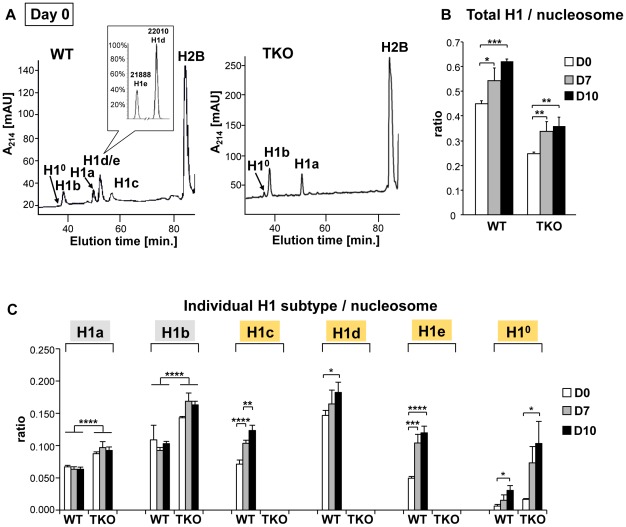
Pluripotent embryonic stem cells (ESCs) are known to possess a relatively open chromatin structure; yet, despite efforts to characterize the chromatin signatures of ESCs, the role of chromatin compaction in stem cell fate and function remains elusive. Linker histone H1 is important for higher-order chromatin folding and is essential for mammalian embryogenesis. To investigate the role of H1 and chromatin compaction in stem cell pluripotency and differentiation, we examine the differentiation of embryonic stem cells that are depleted of multiple H1 subtypes. H1c/H1d/H1e triple null ESCs are more resistant to spontaneous differentiation in adherent monolayer culture upon removal of leukemia inhibitory factor. Similarly, the majority of the triple-H1 null embryoid bodies (EBs) lack morphological structures representing the three germ layers and retain gene expression signatures characteristic of undifferentiated ESCs. Furthermore, upon neural differentiation of EBs, triple-H1 null cell cultures are deficient in neurite outgrowth and lack efficient activation of neural markers. Finally, we discover that triple-H1 null embryos and EBs fail to fully repress the expression of the pluripotency genes in comparison with wild-type controls and that H1 depletion impairs DNA methylation and changes of histone marks at promoter regions necessary for efficiently silencing pluripotency gene Oct4 during stem cell differentiation and embryogenesis. In summary, we demonstrate that H1 plays a critical role in pluripotent stem cell differentiation, and our results suggest that H1 and chromatin compaction may mediate pluripotent stem cell differentiation through epigenetic repression of the pluripotency genes.


Conflict of interest statement

The authors have declared that no competing interests exist.

Figures

Figure 1
Figure 1. Loss of H1c/H1d/H1e inhibits spontaneous ESC differentiation.
(A) Western blot analysis of OCT4 level in WT and H1 TKO ESCs cultured under indicated conditions for 2 days. (B) Phase images of WT and H1 TKO ESCs cultured either on MEF with LIF (left panel), gelatin coated plate with LIF (middle panel), or gelatin coated plate without LIF (right panel) for 2 days. Scale bar: 100 µm. (C) Growth curves of WT and H1 TKO ESCs cultured on gelatin coated plate with or without LIF. Data are presented as average ± S.D.
Figure 2
Figure 2. H1c/H1d/H1e triple knockout ESCs are impaired in EB differentiation.
(A) Hematoxylin and eosin (H&E) staining of sections of WT EBs (top panels) and H1 TKO EBs (bottom panels) at 7 days, 10 days and 14 days in rotary suspension culture. High magnification images of H&E staining of sections of WT EB (top right) and H1 TKO EBs (bottom right) show that TKO EBs failed to cavitate. WT EBs showed more differentiated morphologies with cysts forming (black arrows). (B) Quantitative RT-PCR analysis of mRNA expression levels of AFP in ESCs (day 0) and EBs throughout 14 days of rotary suspension culture. Data were normalized over the expression level of GAPDH and are presented as average ± S.D. (C) Hierarchical clustering analysis of qRT-PCR SuperArray gene expression profiling of ESCs (day 0) and EBs (day 10) formed from WT and H1 TKO ESCs. Red, green or black represent higher, lower, or no change in relative expression. (D) Scatter Plot analysis of gene expression comparisons of: (i) WT vs. H1 TKO ESCs (day 0); (ii) WT EBs (day 10) vs. WT ESCs (day 0); (iii) H1 TKO EBs (day 10) vs. H1 TKO ESCs (day 0). X- and y- axes are delta CTs using GAPDH to normalize. Genes with more than 2-fold differences lie outside of the blue lines.
Figure 3
Figure 3. H1 TKO ESCs fail to undergo neural differentiation.
(A) Neural differentiation scheme for ESCs. (B) Characterization of WT and H1 TKO cultures on day 6+7 under neural differentiation protocol. i). Phase contrast images shows that H1 TKO mutants were unable to adequately form neurites and neural networks. Right panels: zoom-in images of the areas encircled with black rectangles. Scale bar: 100 µm (left panels) and 50 µm (right panels). ii). Left panel: Percentage of neurite-forming EBs. Numbers were averaged from 6 experiments. 80 EBs were counted per experiment. Right panel: Numbers of neurites per neurite-forming EB. Number of neurites was counted from EBs that produced neurites. 58 and 28 neurite-forming EBs from respective WT and TKO were selected and counted for neurite numbers. **: P<0.01; ****: P<0.0001. iii). Immunostaining for expression of TUBB3 and GFAP. Nuclei were stained with Hoechst 33342. Scale bars: 50 µm (left panels) and 20 µm (right panels). Results are representative of three independent experiments. (C) H1 TKO ESCs were unable to adequately repress the pluripotency genes and to efficiently induce the expression of neural genes. Expression levels of pluripotency genes (Oct4 and Nanog), neural marker (Nestin), neuronal marker (Tyrosine hydroxylase (TH)), astrocyte marker (GFAP) from WT and H1 TKO cultures at indicated days in differentiation cultures were determined by qRT-PCR. Data were normalized over the expression level of GAPDH and are presented as average ± S.D.
Figure 4
Figure 4. Expression profiles of linker histones in WT and H1 TKO cultures during EB differentiation.
(A) Reverse-phase HPLC and Mass Spectrometry (inset) analysis of histones from WT and H1 TKO ESCs. X axis: elution time; Y axis: absorbency at A214. mAU, milli-absorbency units. Inset shows the relative signal intensity of H1d and H1e mass spectral peaks in the H1d/H1e fraction collected from HPLC eluates of WT histones. (B,C) H1/nucleosome ratio of the total H1 (B) and individual H1 subtype (C) during EB formation and differentiation. Day 0, day 7 and day 10 of EB cultures were collected and HPLC analyses as shown in (A) were performed. The ratio of total H1 (or individual H1 subtype) to nucleosome was calculated as described in Materials and Methods. Values are means ± S.D., n = 4. *: P<0.05; **: P<0.01; ***: P<0.001; ****: P<0.0001.
Figure 5
Figure 5. H1 is necessary for stable repression of Oct4 pluripotency gene during embryogenesis and ESC differentiation.
(A) Elevated Oct4 expression and hypomethylation of CpG sites at Oct4 promoters in H1 TKO embryos compared with littermates at E8.5. (i) qRT-PCR analysis of mRNA expression levels of Oct4. Values are means ± SEM, n = 5 for each genotype. Expression levels were normalized over GAPDH. *: P<0.05. (ii) Bisulfite sequencing analysis of DNA methylation status at Oct4 promoter regions. Results of two wild-type and two knockout E8.5 embryos are shown. The positions of CpG sites analyzed are depicted schematically as vertical ticks on the line. TSS: transcription start site. (iii) Percentage of methylated CpG sites at Oct4 promoter regions in WT and H1 TKO embryos. Statistical analysis was performed using Fisher's exact test. ***: P<0.001; ****: P<0.0001. (B) Analysis of expression and epigenetic marks at Oct4 pluripotency gene during EB differentiation in rotary suspension culture. Analyses of expression (i), DNA methylation (ii), % of mCpG (iii); and occupancy of H1 and three histone marks (iv) of Oct4 in WT, H1 TKO and RES cells during EB differentiation. Relative expression levels were normalized over GAPDH. Relative fold enrichment is calculated by normalizing the qChIP values (as described in Material and Methods) of ESCs (day 0) or EBs at each time point by that of WT ESCs (WT D0). Values are presented as mean ± S.D. *: P<0.05; **: P<0.01; ***: P<0.001. (C) Model for H1 in repression of Oct4 during ESC differentiation. ESCs have low H1 content with an relatively “open” chromatin. During differentiation, total H1 content increases, which facilitates local chromatin compaction at Oct4 gene and contributes to establishment and/or maintenance of epigenetic changes necessary for stable silencing of Oct4 pluripotency gene.

References

    1. Bernstein BE, Mikkelsen TS, Xie X, Kamal M, Huebert DJ, et al. A bivalent chromatin structure marks key developmental genes in embryonic stem cells. Cell. 2006;125:315–326. - PubMed
    1. Efroni S, Duttagupta R, Cheng J, Dehghani H, Hoeppner DJ, et al. Global transcription in pluripotent embryonic stem cells. Cell Stem Cell. 2008;2:437–447. - PMC - PubMed
    1. Meissner A. Epigenetic modifications in pluripotent and differentiated cells. Nat Biotechnol. 2010;28:1079–1088. - PubMed
    1. Orkin SH, Hochedlinger K. Chromatin connections to pluripotency and cellular reprogramming. Cell. 2011;145:835–850. - PMC - PubMed
    1. Ahmed K, Dehghani H, Rugg-Gunn P, Fussner E, Rossant J, et al. Global chromatin architecture reflects pluripotency and lineage commitment in the early mouse embryo. PLoS ONE. 2010;5:e10531. doi: 10.1371/journal.pone.0010531. - DOI - PMC - PubMed

Publication types

MeSH terms

LinkOut - more resources