

The number of x chromosomes causes sex differences in adiposity in mice
- PMID: 22589744
- PMCID: PMC3349739
- DOI: 10.1371/journal.pgen.1002709
The number of x chromosomes causes sex differences in adiposity in mice
Abstract
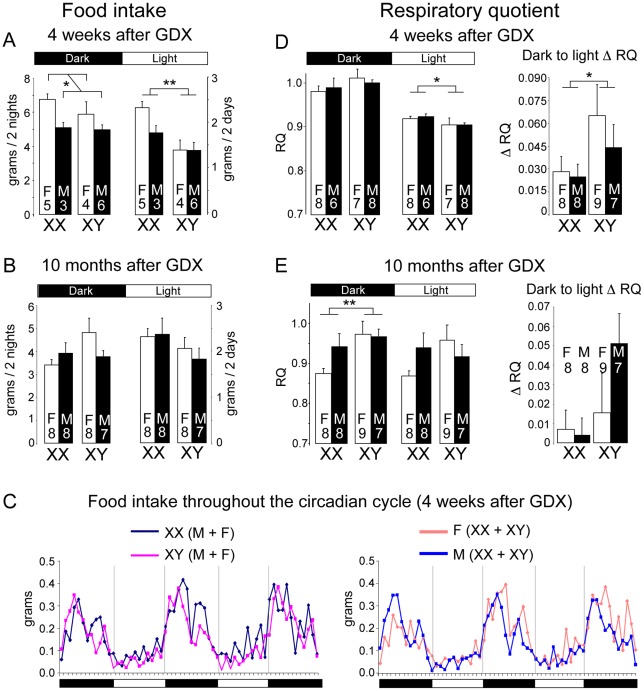
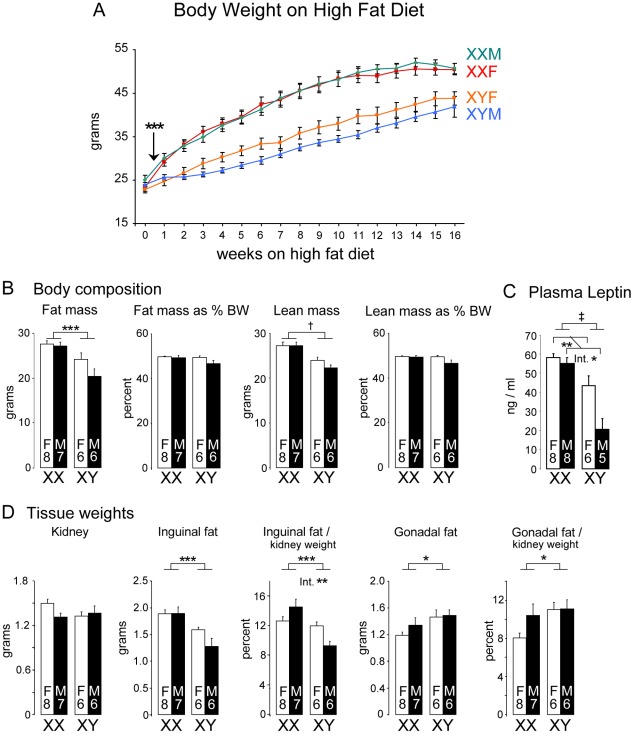
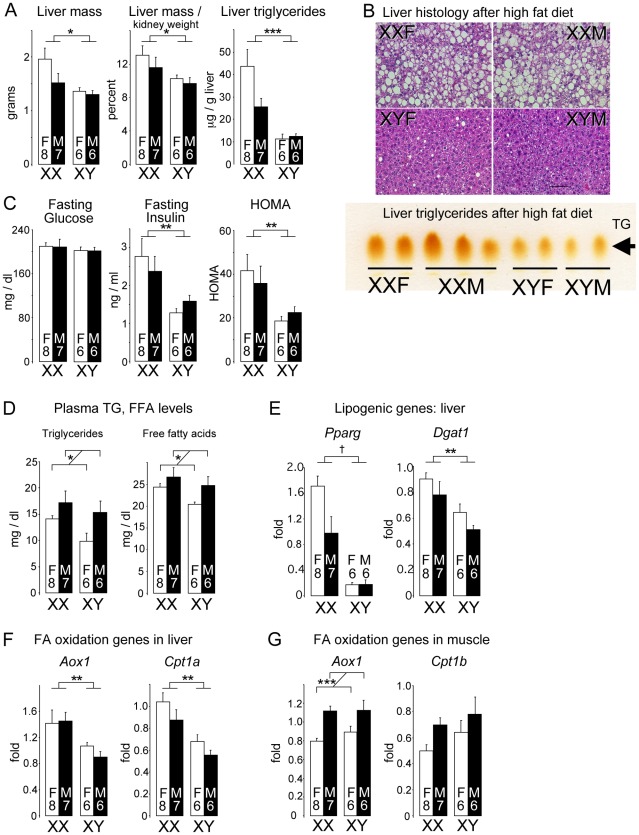
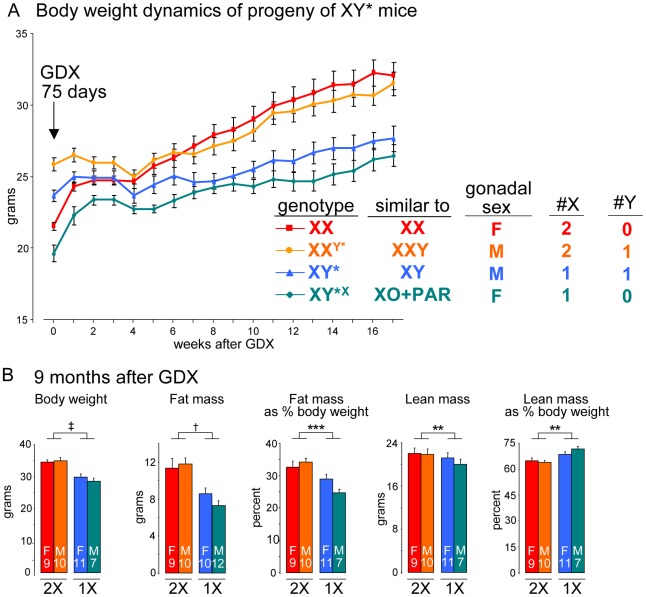
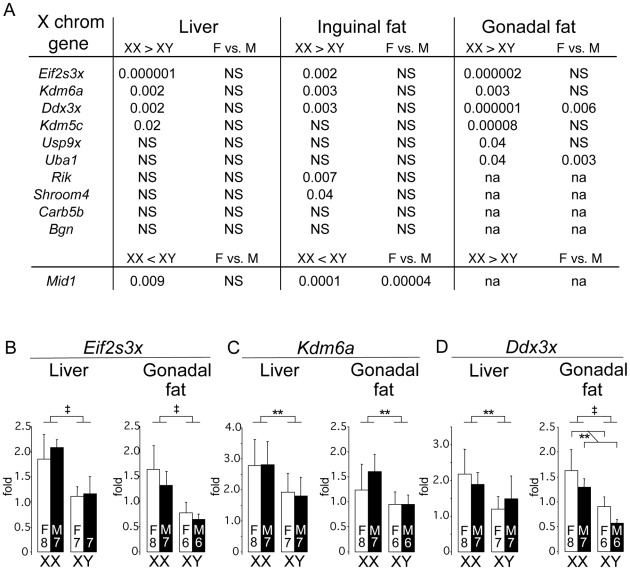
Sexual dimorphism in body weight, fat distribution, and metabolic disease has been attributed largely to differential effects of male and female gonadal hormones. Here, we report that the number of X chromosomes within cells also contributes to these sex differences. We employed a unique mouse model, known as the "four core genotypes," to distinguish between effects of gonadal sex (testes or ovaries) and sex chromosomes (XX or XY). With this model, we produced gonadal male and female mice carrying XX or XY sex chromosome complements. Mice were gonadectomized to remove the acute effects of gonadal hormones and to uncover effects of sex chromosome complement on obesity. Mice with XX sex chromosomes (relative to XY), regardless of their type of gonad, had up to 2-fold increased adiposity and greater food intake during daylight hours, when mice are normally inactive. Mice with two X chromosomes also had accelerated weight gain on a high fat diet and developed fatty liver and elevated lipid and insulin levels. Further genetic studies with mice carrying XO and XXY chromosome complements revealed that the differences between XX and XY mice are attributable to dosage of the X chromosome, rather than effects of the Y chromosome. A subset of genes that escape X chromosome inactivation exhibited higher expression levels in adipose tissue and liver of XX compared to XY mice, and may contribute to the sex differences in obesity. Overall, our study is the first to identify sex chromosome complement, a factor distinguishing all male and female cells, as a cause of sex differences in obesity and metabolism.
Conflict of interest statement
The authors have declared that no competing interests exist.
Figures

Similar articles
-
X and Y chromosome complement influence adiposity and metabolism in mice.Endocrinology. 2013 Mar;154(3):1092-104. doi: 10.1210/en.2012-2098. Epub 2013 Feb 8. Endocrinology. 2013. PMID: 23397033 Free PMC article.
-
Diet, gonadal sex, and sex chromosome complement influence white adipose tissue miRNA expression.BMC Genomics. 2017 Jan 17;18(1):89. doi: 10.1186/s12864-017-3484-1. BMC Genomics. 2017. PMID: 28095800 Free PMC article.
-
Increased high-density lipoprotein cholesterol levels in mice with XX versus XY sex chromosomes.Arterioscler Thromb Vasc Biol. 2015 Aug;35(8):1778-86. doi: 10.1161/ATVBAHA.115.305460. Epub 2015 Jun 25. Arterioscler Thromb Vasc Biol. 2015. PMID: 26112012 Free PMC article.
-
Sex differences in obesity, lipid metabolism, and inflammation-A role for the sex chromosomes?Mol Metab. 2018 Sep;15:35-44. doi: 10.1016/j.molmet.2018.04.003. Epub 2018 Apr 12. Mol Metab. 2018. PMID: 29706320 Free PMC article. Review.
-
Cell-autonomous sex determination outside of the gonad.Dev Dyn. 2013 Apr;242(4):371-9. doi: 10.1002/dvdy.23936. Epub 2013 Mar 1. Dev Dyn. 2013. PMID: 23361913 Free PMC article. Review.
Cited by
-
Obesity, Adipose Tissue and Vascular Dysfunction.Circ Res. 2021 Apr 2;128(7):951-968. doi: 10.1161/CIRCRESAHA.121.318093. Epub 2021 Apr 1. Circ Res. 2021. PMID: 33793327 Free PMC article. Review.
-
Gestational Diabetes Mellitus Affects Offspring's Epigenome. Is There a Way to Reduce the Negative Consequences?Nutrients. 2020 Sep 11;12(9):2792. doi: 10.3390/nu12092792. Nutrients. 2020. PMID: 32933073 Free PMC article. Review.
-
Sex differences in metabolic pathways are regulated by Pfkfb3 and Pdk4 expression in rodent muscle.Commun Biol. 2021 Nov 4;4(1):1264. doi: 10.1038/s42003-021-02790-y. Commun Biol. 2021. PMID: 34737380 Free PMC article.
-
Genetics: Sex and the single cell.Nature. 2017 Oct 4;550(7674):S6-S8. doi: 10.1038/550S6a. Nature. 2017. PMID: 28976954 No abstract available.
-
The sex of specific neurons controls female body growth in Drosophila.PLoS Biol. 2017 Oct 4;15(10):e2002252. doi: 10.1371/journal.pbio.2002252. eCollection 2017 Oct. PLoS Biol. 2017. PMID: 28976974 Free PMC article.
References
-
- Blakemore AI, Froguel P. Investigation of Mendelian forms of obesity holds out the prospect of personalized medicine. Ann N Y Acad Sci. 2010;1214:180–189. - PubMed
-
- Donkor J, Reue K. Mouse models of lipodystrophy. In: Leff T, Granneman J, editors. Adipose Tissue in Health and Disease. Weinheim: Wiley-VCH; 2010. pp. 403–422.
-
- O'Rahilly S. Human genetics illuminates the paths to metabolic disease. Nature. 2009;462:307–314. - PubMed
-
- Kotani K, Tokunaga K, Fujioka S, Kobatake T, Keno Y, et al. Sexual dimorphism of age-related changes in whole-body fat distribution in the obese. Int J Obes Relat Metab Disord. 1994;18:207–202. - PubMed
Publication types
MeSH terms
Substances
Grants and funding
LinkOut - more resources
Full Text Sources
Other Literature Sources
Medical
Molecular Biology Databases
