. 2012 May 10:3:113.
doi: 10.3389/fimmu.2012.00113. eCollection 2012.

Comparative Genomics Reveals Key Gain-of-Function Events in Foxp3 during Regulatory T Cell Evolution

Affiliations

Comparative Genomics Reveals Key Gain-of-Function Events in Foxp3 during Regulatory T Cell Evolution

Kristian G Andersen et al. Front Immunol. .

Abstract

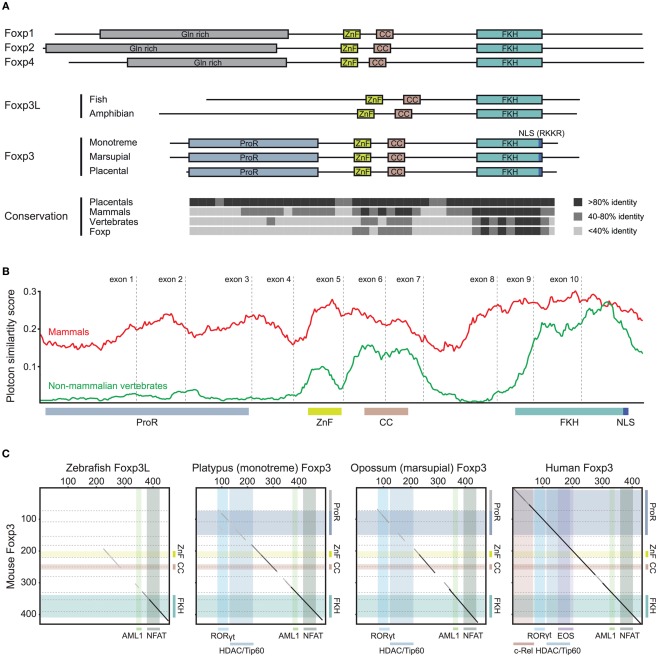
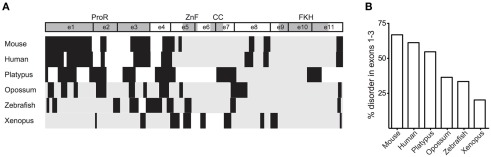
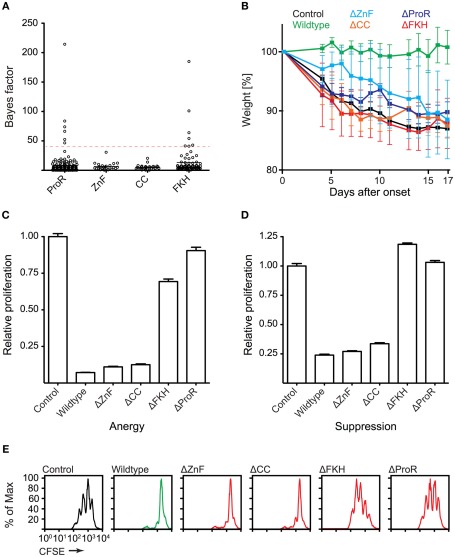
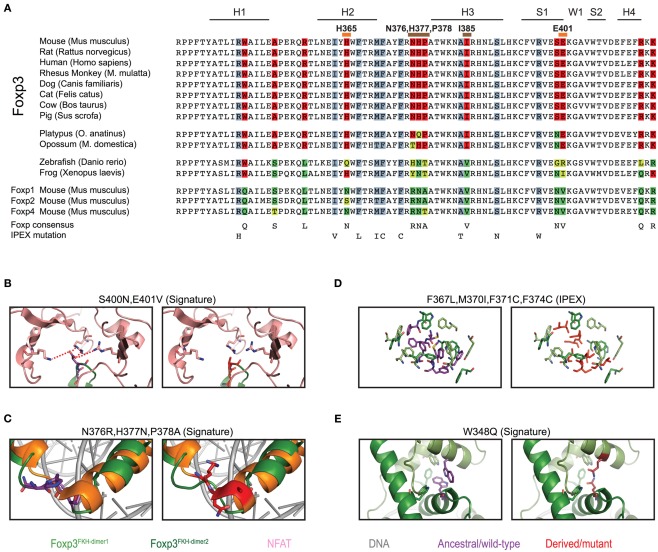
The immune system has the ability to suppress undesirable responses, such as those against commensal bacteria, food, and paternal antigens in placenta pregnancy. The lineage-specific transcription factor Foxp3 orchestrates the development and function of regulatory T cells underlying this immunological tolerance. Despite the crucial role of Foxp3 in supporting immune homeostasis, little is known about its origin, evolution, and species conservation. We explore these questions using comparative genomics, structural modeling, and functional analyses. Our data reveal that key gain-of-function events occurred during the evolution of Foxp3 in higher vertebrates. We identify key conserved residues in its forkhead domain and show a detailed analysis of the N-terminal region of Foxp3, which is only conserved in mammals. These components are under purifying selection, and our mutational analyses demonstrate that they are essential for Foxp3 function. Our study points to critical functional adaptations in immune tolerance among higher vertebrates, and suggests that Foxp3-mediated transcriptional mechanisms emerged during mammalian evolution as a stepwise gain of functional domains that enabled Foxp3 to interact with a multitude of interaction partners.

Keywords: Foxp3; comparative genomics; evolution of immune system; lineage commitment; regulatory T cell.


Figures

Figure 1
Figure 1
Foxp3 orthologs can be found in mammals and jawed vertebrates. (A) Mouse Chr. X 7.10–7.50 mb containing the foxp3 locus and flanking regions with exons shown as vertical bars. A discontinuous whole genome nucleotide alignment is shown below as implemented in the UCSC genome browser (Kent et al., 2002). (B) Continuous dotblot genome alignments of 160 kb flanking the murine foxp3 locus with foxp3 loci of other species (black dots: aligned region; dark blue/green: forward/reverse exons; light blue/green: forward/reverse UTRs). (C) Mouse Chr. X containing foxp3 and adjacent genes with exons shown as vertical black bars. The mammalian consensus (Mammal Cons) represents 20 placental mammals available in the UCSC Genome browser with the height of the green bars denoting the level of conservation in all species determined by BLASTZ (Miller et al., 2007). A discontinuous whole genome nucleotide alignment of the mouse genes in this region with those of other species, irrespective of their location in the genome, are shown as blue bars. The height of the bars corresponds to the level of conservation. Low quality or missing sequence data is shown as gray boxes and alignment gaps are shown as gray double lines. For clarity, only regions containing genes are shown. (D) Conservation of Fox family members. The emergence of the Foxp subfamily coincides with the evolution of adaptive immunity in jawed vertebrates.
Figure 2
Figure 2
Syntenic analysis of the Foxp3 loci in zebrafish. (A) Mouse Chr. X 7.135–7.235 mb containing the foxp3 locus and flanking regions with exons shown as vertical black bars. A discontinuous whole genome nucleotide alignment of the zebrafish genome as determined using BLASTZ (Schwartz et al., 2003) in the UCSC genome browser (Kent et al., 2002) is shown below. Alignments from Chr. 8 are shown in red (Chr. 8 in the region around 21.8 mb), blue (Chr. 8 in the region around 24.1 mb) and green (multiple regions on Chr. 8), and those from other chromosomes in gray. (B) Continuous genome alignments of 160 kb flanking the murine foxp3 locus with the putative foxp3 locus from zebrafish on Chr. 8 in the region of 24.1 mb (black dots: aligned region; dark blue/green: forward/reverse exons; light blue/green: forward/reverse UTRs).
Figure 3
Figure 3
Phylogenetic relationship of Foxp subfamily orthologs. The NCBI and Ensembl databases were queried for full-length protein sequences for Foxp subfamily members. The proteins were aligned and a bootstrapped tree (1000 repetitions) was constructed with the Neighbor Joining algorithm implemented in Geneious (Drummond et al., 2010). Foxn1 was used for out-group rooting. The numbers represent bootstrap values and the scale-bar is equivalent to an average of 20% change in amino acid divergence.
Figure 4
Figure 4
Alignment of Foxp1, Foxp2, Foxp3, and Foxp4 orthologs. (A) Mouse Foxp1 amino acid (aa) sequence aligned to its orthologs in human (92.9% identity; 677aa), opossum (88.3% identity; 677aa), platypus (86.3% identity; 686aa), frog (94.8% identity; 607aa), and zebrafish (78.4% identity; 659aa). (B) Mouse Foxp2 amino acid (aa) sequence aligned to its orthologs in human (99.4% identity; 715aa), opossum (98.7% identity; 713aa), platypus (91.0% identity; 723aa), frog (94.8% identity; 738aa), and zebrafish (78.4% identity; 697aa). (C) Mouse Foxp3 protein sequence aligned to its putative orthologs in human (86.5% identity; 431aa), opossum (48% identity; 473aa), platypus (55.5% identity; 502aa), frog (34.5% identity; 593aa), and zebrafish (30.1% identity; 376aa). (D) Mouse Foxp4 protein sequence aligned to its putative orthologs in human (92.3% identity; 680aa), opossum (55.7% identity; 677aa), platypus (69.7% identity; 670aa), frog (70.8% identity; 641aa), and zebrafish (69.7% identity; 670aa). The gray arrows show the position of the putative functional domains within the aligned sequence. Identical amino acids are represented by black bars, similar amino acids by gray bars, and not similar amino acids by white bars. Gaps are shown as black line.
Figure 5
Figure 5
Stepwise gain of Foxp3 domains. (A) Representative schematic of the functional domains of Foxp1, Foxp2, Foxp3, and Foxp4 that can be found in mammalian proteins. (ProR, Proline-rich region; ZnF, zinc finger; CC, coiled-coil; FKH, forkhead; NLS, nuclear localization signal. All domains are drawn to scale using mouse proteins). The conservation across the Fox family members is shown as the percent identity in windows of 10 amino acids over the length of mouse Foxp3 as compared to the placental (8 species), mammalian (10 species), and vertebrate (3 species) consensus as well as that of the mouse Foxp subfamily. (B) A conservation plot showing the average similarity score at individual amino acid positions from multiple sequence alignments of mammalian Foxp3 (red; 10 species) and non-mammalian vertebrate Foxp3L (green; 7 species). The plots were generated using EMBOSS plotcon with a window size of 20 (Rice et al., 2000). (C) Dotblot alignments of Foxp3 proteins with the predicted interaction partners and functional domains overlaid (based on mouse Foxp3; black lines: strongly aligned regions; gray lines: aligned regions; dotted lines: exon boundaries; x-axis color overlays: binding regions of known interaction partners; y-axis color overlays: predicted functional domains).
Figure 6
Figure 6
The ProR is disordered in placentals. (A) The disorder of Foxp3 from various species was calculated using GlobPlot (Linding, 2003). (B) The percentage of disorder in the ProR from the various species. Since not all Foxp3s have a ProR, the part of the N-terminal region having the best alignment to mouse Foxp3 was chosen from these organisms.
Figure 7
Figure 7
Functionally important Foxp3 domains are under purifying selection in placentals. (A) The REL (Kosakovsky Pond and Frost, 2005) test as implemented in Datamonkey (Pond and Frost, 2005) was used to perform a selection analysis of placental Foxp3s. Bayes factor scores of individual codons from the ProR, ZnF, CC, and FKH are shown (dotted red line: arbitrary Bayes factor cutoff for purifying selection). (B–E) T cells were transduced with wildtype or mutant Foxp3 as well as an irrelevant control gene. (B) The ability of the transduced cells to prevent weight loss by co-transferred “aggressor” T cells was measured by following the mean weight of the mice (n ≥ 4 per group) normalized to their weight on the day of onset in control mice. (wildtype vs. mutants: P ≤ 0.001 in each case; one-way ANOVA). (C–E) Suppressive activity and induction of anergy (non-proliferation) in the transduced T cells as shown by the relative proliferation normalized to that of control transduced cells of (C) “target” T cells or (D) transduced T cells. (E) Representative CFSE-profiles of “target” T cell proliferation. Error-bars represent the SEM.
Figure 8
Figure 8
Mammalian evolution of the forkhead. (A) Alignment of Foxp subfamily FKH domains. Foxp3-specific signature residues are highlighted in red, whereas those of other Foxp subfamilies are highlighted in shades of green. IPEX mutations are underlaid in blue. Signature residues predicted to be involved in NFAT interaction or to affect DNA binding are marked with orange and brown lines respectively (H, helix; S, β-sheet; W, wing). (B–E) Predicted effects of signature residue and IPEX mutations on the structure of Foxp3. Wildtype residues are shown in the left panel, whereas mutants/Foxp consensus residues are shown on the right. Red lines represent attractive forces. (C) Structure alignment of helix 2 and 3 of the FKH of Foxp3 (green; Bandukwala et al., 2011) and Foxp2 (orange; Stroud et al., 2006) with the Foxp3-specific (left panel; purple) and Foxp2 (right panel; red) residues highlighted.
Figure 9
Figure 9
The predicted effects of point mutations in the Foxp3 forkhead. (A–E) IPEX point mutants in Foxp3 (right) with the corresponding wildtype residue (left). (F–J) Foxp3-specific signature residues (left) compared to the Foxp consensus (right).
Figure 10
Figure 10
Identification of Functionally Important Residues in the Foxp3 forkhead domain. (A) Structure of the domain-swapped FKH of Foxp3 (light green: monomer 1; dark green: monomer 2) in complex with NFAT (pink) and DNA (gray; Bandukwala et al., 2011). Red: signature residues; blue: IPEX mutations. (B) Surface accessibility of IPEX and signature residues of the domain-swapped FKH calculated using GetArea (Fraczkiewicz and Braun, ; *P-value < 0.05, unpaired t test). (C–E) T cells were transduced with wildtype Foxp3, IPEX mutants, or an irrelevant control gene. (C,D) Suppressive activity and induction of anergy in the transduced T cells as shown by the relative proliferation normalized to that of control transduced cells of (C) “target” T cells or (D) transduced T cells. (E) Representative FACS plots of the expression of Foxp3 target genes in the transduced T cells (at least three independent experiments). (F–H) Foxp3 mutants containing reverted signature residues predicted to be involved in NFAT interaction (NFATmut with H365N and E401V) or influence DNA binding (DNAmut with N376R, H377N, P378A, I385V) or a deletion of the entire FKH (ΔFKH) were created and expressed in T cells. As a control, the cells were transduced with an irrelevant control gene. (F) Bar graphs showing the mean fluorescence intensity (MFI) by FACS analysis of Foxp3 target genes in transduced cells as compared to the non-transduced cells within the same well (two independent experiments). (G) Suppressive activity and induction of anergy in the transduced T cells (two independent experiments). (H) The ability of the transduced cells to prevent weight loss caused by co-transferred “aggressor” T cells was measured by following the mean weight of the mice (n ≥ 4 per group) normalized to their weight on the day of onset in control mice. P values determined by one-way ANOVA; ns, not significant; *≤0.05, ***≤0.001. Error-bars represent the SEM.
Figure 11
Figure 11
Stepwise gain of functional domains during Foxp3 evolution. The topology and divergence timeline on the phylogenetic tree are adapted from previous studies (Woodburne et al., ; Brawand et al., 2008). The presence of a domain in the Foxp3 orthologs is denoted by a plus sign. Within the FKH the presence of Foxp3-specific signature residues is distinguished. The incremental gain of functional domains and signature residues is schematically represented. *The protein data available for lizard (Anolis carolinensis) is restricted to part of the FKH.

References

    1. Aluvihare V. R., Kallikourdis M., Betz A. G. (2004). Regulatory T cells mediate maternal tolerance to the fetus. Nat. Immunol. 5, 266–27110.1038/ni1037 - DOI - PubMed
    1. Andersen K. G., Butcher T., Betz A. G. (2008). Specific immunosuppression with inducible Foxp3-transduced polyclonal T cells. PLoS Biol. 6, e276.10.1371/journal.pbio.0060276 - DOI - PMC - PubMed
    1. Bandukwala H. S., Wu Y., Feuerer M., Chen Y., Barboza B., Ghosh S., Stroud J. C., Benoist C., Mathis D., Rao A., Chen L. (2011). Structure of a domain-swapped FOXP3 dimer on DNA and its function in regulatory T cells. Immunity 34, 479–49110.1016/j.immuni.2011.02.017 - DOI - PMC - PubMed
    1. Bloor S., Ryzhakov G., Wagner S., Butler P. J., Smith D. L., Krumbach R., Dikic I., Randow F. (2008). Signal processing by its coil zipper domain activates IKK gamma. Proc. Natl. Acad. Sci. U.S.A. 105, 1279–128410.1073/pnas.0706552105 - DOI - PMC - PubMed
    1. Brawand D., Wahli W., Kaessmann H. (2008). Loss of egg yolk genes in mammals and the origin of lactation and placentation. PLoS Biol. 6, e63.10.1371/journal.pbio.0060063 - DOI - PMC - PubMed