. 2012;7(5):e36384.
doi: 10.1371/journal.pone.0036384. Epub 2012 May 9.

A genome-wide siRNA screen to identify modulators of insulin sensitivity and gluconeogenesis

Affiliations

A genome-wide siRNA screen to identify modulators of insulin sensitivity and gluconeogenesis

Ruojing Yang et al. PLoS One. 2012.

Abstract

Background: Hepatic insulin resistance impairs insulin's ability to suppress hepatic glucose production (HGP) and contributes to the development of type 2 diabetes (T2D). Although the interests to discover novel genes that modulate insulin sensitivity and HGP are high, it remains challenging to have a human cell based system to identify novel genes.

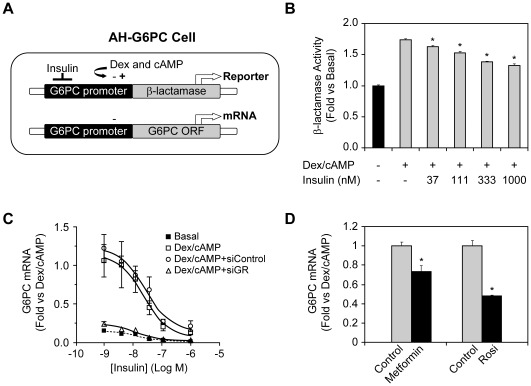
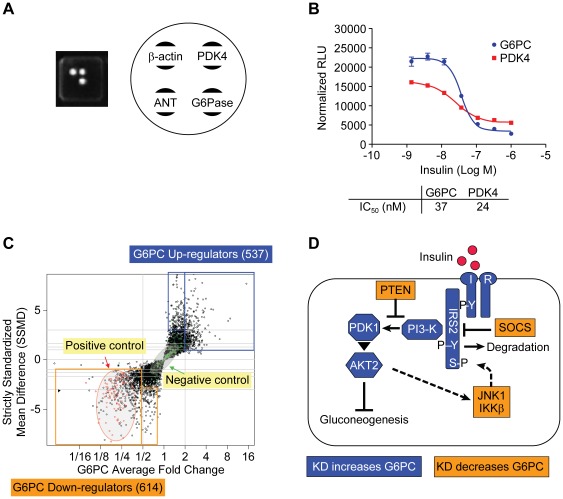
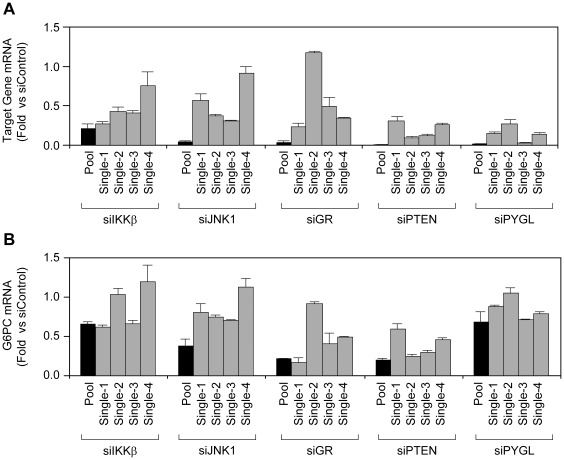
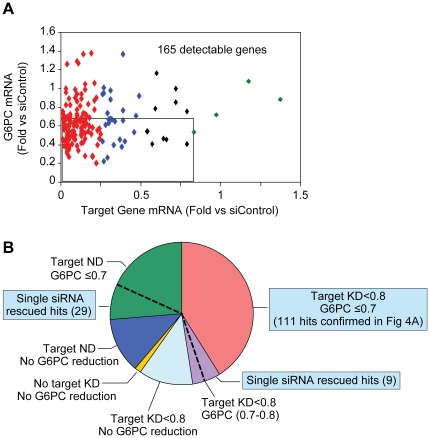
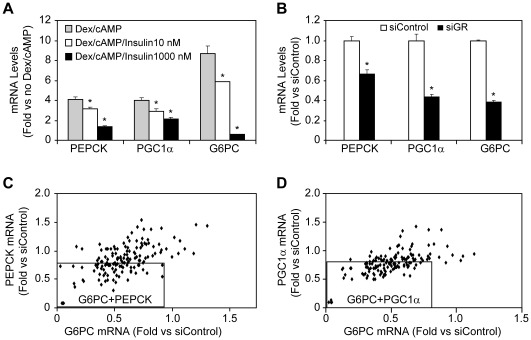
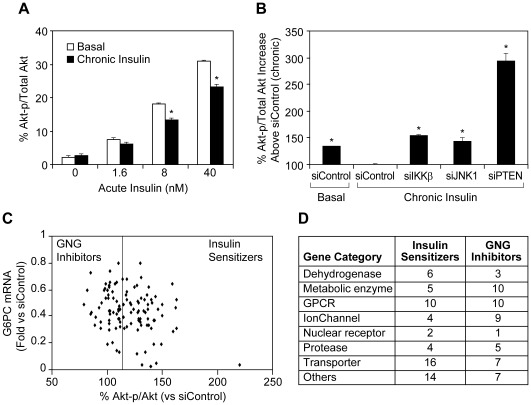
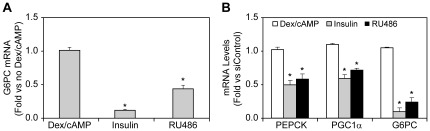
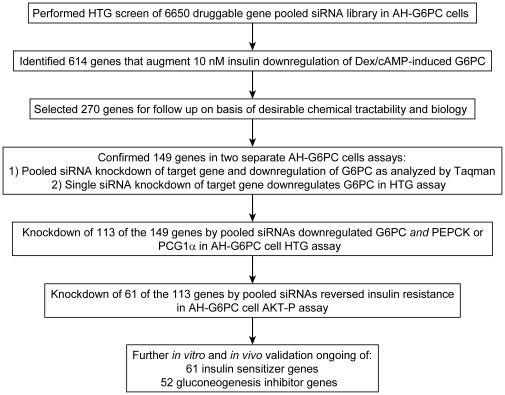
Methodology/principal findings: To identify genes that modulate hepatic insulin signaling and HGP, we generated a human cell line stably expressing beta-lactamase under the control of the human glucose-6-phosphatase (G6PC) promoter (AH-G6PC cells). Both beta-lactamase activity and endogenous G6PC mRNA were increased in AH-G6PC cells by a combination of dexamethasone and pCPT-cAMP, and reduced by insulin. A 4-gene High-Throughput-Genomics assay was developed to concomitantly measure G6PC and pyruvate-dehydrogenase-kinase-4 (PDK4) mRNA levels. Using this assay, we screened an siRNA library containing pooled siRNA targeting 6650 druggable genes and identified 614 hits that lowered G6PC expression without increasing PDK4 mRNA levels. Pathway analysis indicated that siRNA-mediated knockdown (KD) of genes known to positively or negatively affect insulin signaling increased or decreased G6PC mRNA expression, respectively, thus validating our screening platform. A subset of 270 primary screen hits was selected and 149 hits were confirmed by target gene KD by pooled siRNA and 7 single siRNA for each gene to reduce G6PC expression in 4-gene HTG assay. Subsequently, pooled siRNA KD of 113 genes decreased PEPCK and/or PGC1alpha mRNA expression thereby demonstrating their role in regulating key gluconeogenic genes in addition to G6PC. Last, KD of 61 of the above 113 genes potentiated insulin-stimulated Akt phosphorylation, suggesting that they suppress gluconeogenic gene by enhancing insulin signaling.

Conclusions/significance: These results support the proposition that the proteins encoded by the genes identified in our cell-based druggable genome siRNA screen hold the potential to serve as novel pharmacological targets for the treatment of T2D.


Conflict of interest statement

Competing Interests: The authors have the following competing interest: All authors were employees of Merck Research Laboratories at the time of the study. There are no patents, products in development or marketed products to declare. This does not alter the authors’ adherence to all the PLoS ONE policies on sharing data and materials, as detailed online in the guide for authors.

Figures

Figure 1
Figure 1. Generation of the hormone-responsive human hepatoma cell line, AH-G6PC, and optimization of assay conditions for siRNA transfection.
A. AH-G6PC cells express both the reporter gene, β-lactamase, under the control of the G6PC promoter and endogenous G6PC. B. Insulin dose-responsively decreases Dex/cAMP activation of β-lactamase activity. C. Changes in endogenous G6PC mRNA levels in AH-G6PC cells treated with vehicle (basal), Dex/cAMP, Dex/cAMP after transfection with control siRNAs (siControl), or Dex/cAMP after transfection with glucocorticoid receptor siRNAs (siGR), and increasing concentrations of insulin. D. Incubation of AH-G6PC cells with metformin (667 µM) for 16 h or rosiglitazone (10 uM) for 6 h reduces G6PC mRNA expression. Data are shown as the means ± SEM fold change relative to basal (no Dex/cAMP or insulin) in a study performed in triplicate, and is representative of multiple experiments. *, P<0.05 by Student’s t-test vs. Dex/cAMP-treated samples.
Figure 2
Figure 2. Screening of a druggable siRNA library with a 4-gene High-Throughput-Genomics (HTG) assay.
A. Layout of genes within each well of a 4-gene HTG 384-well ArrayPlate. B. Insulin dose-responsively inhibits Dex/cAMP induction of G6PC and PDK4 mRNA expression in AH-G6PC cells when assayed by the HTG platform. Data are presented as the means ± SEM of a study performed in triplicate; similar results were obtained in 4 independent experiments. C. Dual-flashlight plot comparing SSMD values vs. average fold change in G6PC mRNA expression by all siRNA pools in the library in order to select hits that regulate G6PC mRNA levels. Glucocorticoid receptor (GR) siRNAs were used as positive controls in each plates (red dots), while non-targeting siRNAs were used as negative controls in each plate (green dots). The blue square and the small rectangle represent the up-regulators with G6PC ≥2 and SSMD ≥1 and G6PC ≥1.3 and SSMD ≥2, respectively. The orange square and the small rectangle represent the down-regulators with G6PC≤1/2 and SSMD≤−1 and G6PC≤0.7 and SSMD≤−2, respectively. D. Major proximal molecular mediators and key negative modulators of hepatic insulin signaling. siRNA knockdown of target genes that lowered and increased G6PC mRNA expression are indicated in orange and blue, respectively.
Figure 3
Figure 3. Pooled siRNAs demonstrate greater knockdown efficacy than single siRNAs.
Comparison of the ability of transfected pooled vs. single siRNAs to A. knockdown target gene mRNA levels and B. reduce G6PC mRNA levels in AH-G6PC cells incubated with Dex/cAMP and 10 nM insulin for 6 h. Black bars are pooled siRNA samples; grey bars are single siRNA samples. Data are presented as fold changes relative to mRNA expression in siControl-transfected cells and are the means of 3 independent experiments for A and B.
Figure 4
Figure 4. Confirmation of primary screen hits by 2 distinct siRNA assays.
A. Pooled siRNA knockdown of 165 Taqman-detectable primary hits vs. reduction of G6PC mRNA expression as determined by Taqman qPCR analysis. Data are shown as fold change compared to mRNA expression in siControl-transfected cells and are the means of a study performed in triplicate. The square contains 111 primary hits that reduce G6PC and target gene expression by ≤0.7- and ≤0.8-fold, respectively. Red, blue, black, and green dots represent target gene knockdown by <0.25-fold, between 0.25-fold to 0.5-fold, between 0.5-fold to 0.8-fold, and no knockdown, respectively. B. Schematic diagram for the 270 primary screen hits separated into different categories after target gene knockdown study. Red represents the 111 hits identified above in A. Blue, orange, and light blue represent primary hits that were not confirmed due to lack of G6PC knockdown. Sets of 7 distinct single siRNAs to each of the 270 primary screen hits were tested for their ability to diminish G6PC expression using the 4-gene HTG platform to quantify mRNA levels. Any target gene for which ≥2 single siRNAs reduced G6PC mRNA was deemed “rescued”. This assay rescued 9 primary hits whose siRNA knocked down their target gene mRNA but only reduced G6PC mRNA between 0.7- to 0.8-fold (purple) and 29 primary hits that were undetectable by Taqman analysis in the pooled siRNA confirmation assay described in A, but were detectable using enriched cDNA as describe in the “Results” section (green). The blue squares label the gene subsets that were combined to become our final 149 confirmed hits using the confirmation strategy described here. ND: undetectable by Taqman analysis; KD: knockdown.
Figure 5
Figure 5. Use of a multiplex HTG assay to identify confirmed hit siRNA pools that decrease expression of key gluconeogenic genes in addition to G6PC.
A. Dex/cAMP increases and insulin dose-dependently reduces AH-G6PC cell PEPCK, PGC1α, and G6PC mRNA expression. Data are presented as the means ± SEM of fold change relative to untreated cells in 3 independent experiments. B. Knockdown of GR by siRNA significantly reduces PEPCK, PGC1α, and G6PC mRNA in AH-G6PC cells incubated with Dex/cAMP and 10 nM insulin. Data are presented as the means ± SEM of fold change relative to mRNA expression in siControl-transfected cells in 3 independent experiments. C. Subsets of pooled siRNAs targeting confirmed hits regulate G6PC and PEPCK, or D. G6PC and PGC1α mRNA expression, in AH-G6PC cells treated with Dex/cAMP and 10 nM insulin. Data in Figures 5C and 5D are plotted as fold change relative to mRNA expression in siControl-transfected cells and are the means of 3 independent experiments. The squares contains siRNAs that reduced both G6PC and PEPCK (C) or G6PC and PGC1α (D) expression by 20% and 15%, respectively.
Figure 6
Figure 6. Identification of insulin sensitizer and GNG inhibitor genes.
A. Chronic (16 h) 100 nM insulin pretreatment reduces acute (15 min) insulin induction of Akt phosphorylation (Akt-p) in AH-G6PC cells. Akt-p data are presented as the means ± SEM of % Akt-p/total Akt from a representative experiment performed in triplicate. B. Pooled siRNAs targeting JNK1, IKKβ, or PTEN significantly potentiates acute insulin-induced Akt-p after chronic insulin preincubation. Akt-p data are presented as the % Akt-p/total Akt relative to siControl-transfected cells (set as 100%) in response to acute insulin treatment after chronic insulin preincubation and are the means ± SEM of a representative experiment performed in triplicate. C. Differential impact of pooled siRNAs targeting each of the 113 genes described in figures 5C and 5D in regulating G6PC mRNA expression vs. potentiating insulin-induced Akt-p. Hits were separated into insulin sensitizers and GNG inhibitors that augmented acute insulin induction of Akt-p by more and less than 15% (vertical line), respectively. Akt-p data are presented as the % Akt-p/total Akt relative to siControl-transfected cells (set as 100%) in response to acute insulin treatment after chronic insulin preincubation and are the means of 3 independent experiments. G6PC mRNA expression data were obtained from figures 5C and 5D. D. Table summarizing the number of insulin sensitizer and GNG inhibitor hits in distinct druggable gene categories.
Figure 7
Figure 7. Pharmacological inhibitor of glucocorticoid receptor (GR) led to similar reduction of gluconeogenesis gene expression to GR siRNA in AH-G6PC cell.
AH-G6PC cells were preincubated with or without the GR antagonist RU486 (5 µM) for 18 h. The cells were then incubated with Dex/cAMP alone, Dex/cAMP plus 400 nM insulin, or Dex/cAMP plus RU486 (in the cells treated with RU486 overnight) for 6 h. A. Taqman analysis was performed on mRNA isolated from the cells to assay G6PC mRNA relative to Dex/cAMP treated cells. B. Multiplex HTG ArrayPlate analysis of mRNA isolated from the cells was used to quantify PEPCK, PGC1α, and G6PC mRNA expression. Data are plotted as fold change vs. mRNA levels in cells treated only with Dex/cAMP and are the means ± SEM of 3 independent experiments.
Figure 8
Figure 8. Schematic summary of the siRNA screening process that identified, confirmed, and characterized novel insulin sensitizer and GNG inhibitor target genes.

References

    1. Saltiel AR. New perspectives into the molecular pathogenesis and treatment of type 2 diabetes. Cell. 2001;104:517–529. - PubMed
    1. Yang R, Trevillyan JM. c-Jun N-terminal kinase pathways in diabetes. Int J Biochem Cell Biol. 2008;40:2702–2706. - PubMed
    1. Zimmet P, Alberti KG, Shaw J. Global and societal implications of the diabetes epidemic. Nature. 2001;414:782–787. - PubMed
    1. Hundal RS, Krssak M, Dufour S, Laurent D, Lebon V, et al. Mechanism by which metformin reduces glucose production in type 2 diabetes. Diabetes. 2000;49:2063–2069. - PMC - PubMed
    1. Mithieux G, Guignot L, Bordet JC, Wiernsperger N. Intrahepatic mechanisms underlying the effect of metformin in decreasing basal glucose production in rats fed a high-fat diet. Diabetes. 2002;51:139–143. - PubMed

Substances