. 2012;7(5):e36814.
doi: 10.1371/journal.pone.0036814. Epub 2012 May 10.

An abundant tissue macrophage population in the adult murine heart with a distinct alternatively-activated macrophage profile

Affiliations

An abundant tissue macrophage population in the adult murine heart with a distinct alternatively-activated macrophage profile

Alexander R Pinto et al. PLoS One. 2012.

Abstract

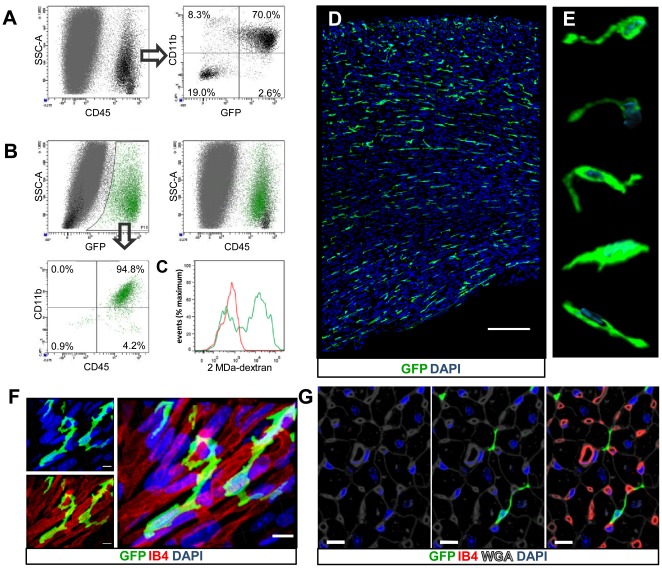
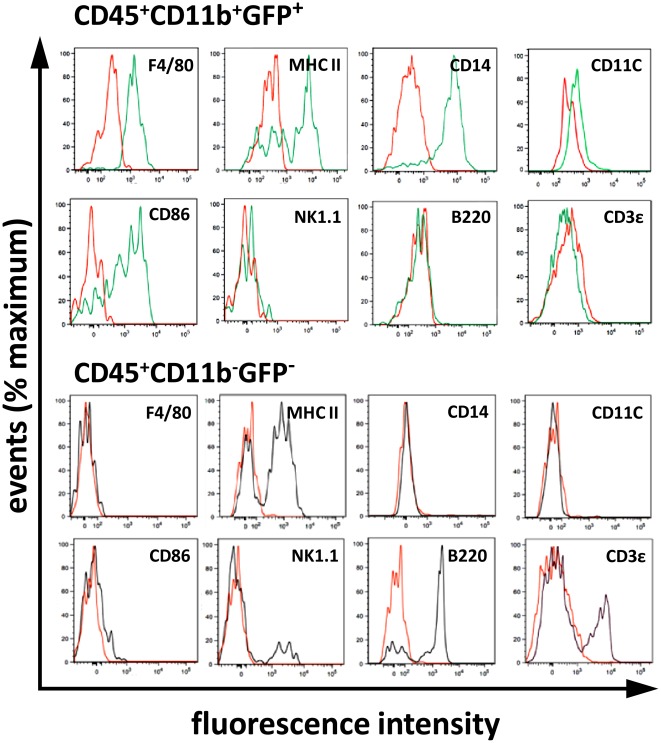
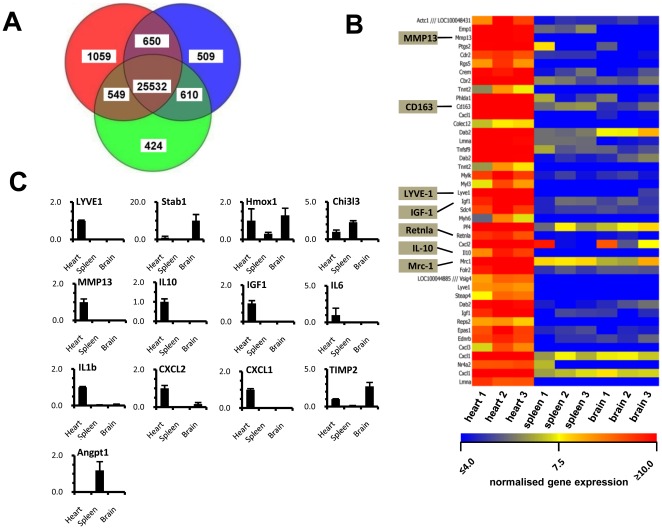
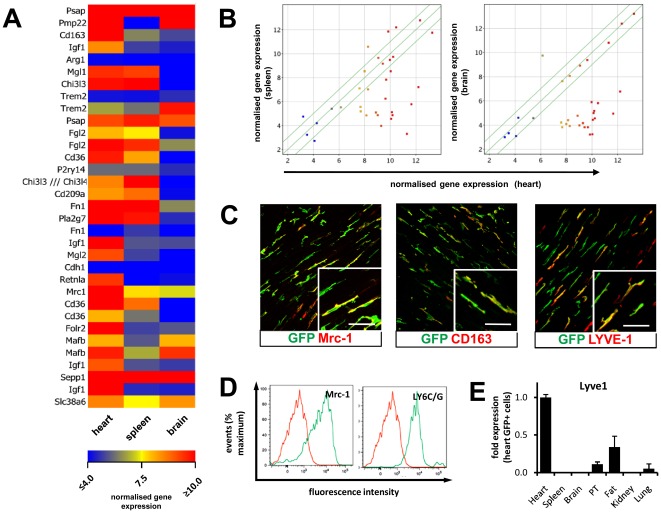
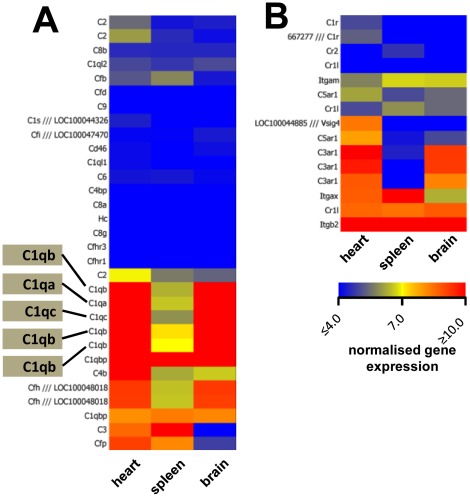
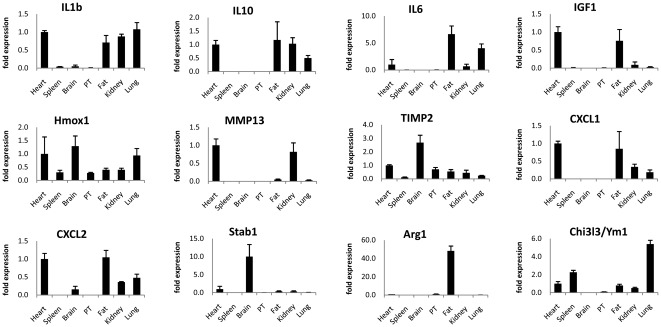
Cardiac tissue macrophages (cTMs) are a previously uncharacterised cell type that we have identified and characterise here as an abundant GFP(+) population within the adult Cx(3)cr1(GFP/+) knock-in mouse heart. They comprise the predominant myeloid cell population in the myocardium, and are found throughout myocardial interstitial spaces interacting directly with capillary endothelial cells and cardiomyocytes. Flow cytometry-based immunophenotyping shows that cTMs exhibit canonical macrophage markers. Gene expression analysis shows that cTMs (CD45(+)CD11b(+)GFP(+)) are distinct from mononuclear CD45(+)CD11b(+)GFP(+) cells sorted from the spleen and brain of adult Cx(3)cr1(GFP/+) mice. Gene expression profiling reveals that cTMs closely resemble alternatively-activated anti-inflammatory M2 macrophages, expressing a number of M2 markers, including Mrc1, CD163, and Lyve-1. While cTMs perform normal tissue macrophage homeostatic functions, they also exhibit a distinct phenotype, involving secretion of salutary factors (including IGF-1) and immune modulation. In summary, the characterisation of cTMs at the cellular and molecular level defines a potentially important role for these cells in cardiac homeostasis.


Conflict of interest statement

Competing Interests: The authors have declared that no competing interests exist.

Figures

Figure 1
Figure 1. Detection of GFP+ cells within adult Cx3cr1GFP/+ mouse hearts.
(A) Scatter profiles showing CD45+ cells in the adult mouse heart (left panel) and the expression of CD11b and GFP within this population (right panel). (B) Scatter profile of GFP+ cells (green), with CD45+GFP (black) and CD45GFP cells and debris (grey) shown (top left panel). (Top right panel) scatter profile of CD45+ cells (as shown in figure 1A left panel) with GFP+ cells, GFP cells and debris indicated (green, black and grey respectively; based on gating from figure 1A). (Bottom left panel) scatter profile of CD11b and CD45 expression within GFP+ cells. (C) 2 MDa dextran uptake by CD45+CD11b+GFP+ cells. (D) 45 µm projection view of a cross sectional image of the adult Cx3cr1GFP/+ mouse heart left ventricle. Scale bar = 150 µm. (E) 3D projections of typical GFP+ (green) cells from the left ventricular myocardium with isosurface rendering of nuclei (blue). Figures representative of at least 3 independent experiments. (F) Magnified projection view of GFP+ cells with perivascular position shown (capillaries stained with IB4; nuclei stained with DAPI). Scale bar = 5 µm. (G) Optical section of GFP+ cells with perivascular (capillaries stained with IB4) and pericardiomyocyte position (cardiomyocyte cell surface stained with WGA; nuclei stained with DAPI). Scale bar = 10 µm. All images representative of at least 3 similar independent experiments.
Figure 2
Figure 2. Immunophenotype of cTMs within adult Cx3cr1GFP/+ mouse hearts.
Representative histograms for myeloid (F4/80, CD11c, MHC-II (IAb), CD14, CD86) and lymphoid (CD3ε, B220) related markers detected in CD45+CD11b+GFP+ population and CD45+CD11bGFP population. Red line shows isotype control staining. Histograms representative of at least 4 experiments, with mouse group sizes of at least 4 mice.
Figure 3
Figure 3. Microarray gene expression analysis of cTMs and GFP+ cells from the spleen and brain.
(A) Venn-diagram of differentially expressed genes from cTMs (blue) and GFP+ cells from the spleen (green) and brain (red). (B) Heat map of genes enriched greater than 20-fold in cTMs compared to GFP+ cells from the spleen and brain. Heat map displays data from each individually isolated GFP+ populations. (C) qRT-PCR histograms conducted on selected genes to determine unique enrichment in cTMs (Lyve-1, IGF1, MMP13, IL10, IL6, IL1b, CXCL1, and CXCl2), enrichment in both cTMs and GFP+ cells from the brain (Stab1, Timp2), enrichment in GFP+ cells from the spleen (Angpt1) and expression in all three populations (Hmox1). Histograms show mean ± SEM. For microarray analysis, 3 biological replicate samples of GFP+ cells from the heart, spleen and brain were prepared in 3 independent isolation procedures for each tissue. Cardiac and brain tissue from 4 mice were used to isolate sufficient number of cells in each independent cell isolation, whereas splenic cells were isolated from at least 2–4 mice.
Figure 4
Figure 4. Expression of M2 macrophage markers by cTMs.
(A) Heat map of M2 related gene expression by cTMs and GFP+ cells from the spleen and brain by microarray analysis. (B) Scatter/correlation profile of M2 related genes expressed by cTMs (heart) and genes expressed in GFP+ cells from the spleen and brain. (C) Micrographs of adult Cx3cr1GFP/+ mouse heart sections stained for GFP, Mrc1, CD163 and Lyve-1. Scale bar = 30 µm. (D) Flow cytometry histogram showing expression of M2 markers Mrc1 and Ly6C/G by cTMs. Histograms are representative of at least 4 independent experiments. (E) qRT-PCR analysis of Lyve-1 expression by GFP+ cells from different tissues. Mean values determined for respective tissues are normalised to means obtained for heart. Histograms show mean ± SEM (n = 3).
Figure 5
Figure 5. Expression of complement opsonisation components cTMs and GFP+ cells from the spleen and brain.
Microarray analysis derived heat maps of complement pathway related gene expression by cTMs and GFP+ cells from the spleen and brain identified by microarray gene expression analysis. (A) Secreted complement factors with probes corresponding to C1q members highlighted. (B) Complement receptors.
Figure 6
Figure 6. Differential gene expression by GFP+ populations from adult Cx3cr1GFP/+ mouse tissues determined by qRT-PCR.
Means for respective genes from various tissues are normalised to the means obtain for heart (IL1β, IL6, CXCL1, CXCL2, IL10, IGF1, MMP13, Timp2, and Hmox1), lung (Angpt1), or peritoneum (PT; Arg1). Histograms show mean ± SEM (n = 3 independent cell and RNA isolation experiments). RNA for 3 biological replicate samples of GFP+ cells of various tissues were prepared in 3 independent isolation procedures for each tissue. For all tissues except spleen, GFP+ cells were isolated from 4–7 mice in each independent cell isolation. Splenic GFP+ cells were isolated from groups of 2–4 mice per replicate.

References

    1. Auffray C, Sieweke MH, Geissmann F. Blood monocytes: development, heterogeneity, and relationship with dendritic cells. Annu Rev Immunol. 2009;27:669–692. - PubMed
    1. Gordon S, Taylor PR. Monocyte and macrophage heterogeneity. Nat Rev Immunol. 2005;5:953–964. - PubMed
    1. Jung S, Aliberti J, Graemmel P, Sunshine MJ, Kreutzberg GW, et al. Analysis of fractalkine receptor CX(3)CR1 function by targeted deletion and green fluorescent protein reporter gene insertion. Mol Cell Biol. 2000;20:4106–4114. - PMC - PubMed
    1. Davalos D, Grutzendler J, Yang G, Kim JV, Zuo Y, et al. ATP mediates rapid microglial response to local brain injury in vivo. Nat Neurosci. 2005;8:752–758. - PubMed
    1. Nimmerjahn A, Kirchhoff F, Helmchen F. Resting microglial cells are highly dynamic surveillants of brain parenchyma in vivo. Science. 2005;308:1314–1318. - PubMed

Publication types

MeSH terms