. 2012;7(5):e36916.
doi: 10.1371/journal.pone.0036916. Epub 2012 May 10.

Extracellular nucleotides inhibit insulin receptor signaling, stimulate autophagy and control lipoprotein secretion

Affiliations

Extracellular nucleotides inhibit insulin receptor signaling, stimulate autophagy and control lipoprotein secretion

Cynthia Chatterjee et al. PLoS One. 2012.

Abstract

Hyperglycemia is associated with abnormal plasma lipoprotein metabolism and with an elevation in circulating nucleotide levels. We evaluated how extracellular nucleotides may act to perturb hepatic lipoprotein secretion. Adenosine diphosphate (ADP) (>10 µM) acts like a proteasomal inhibitor to stimulate apoB100 secretion and inhibit apoA-I secretion from human liver cells at 4 h and 24 h. ADP blocks apoA-I secretion by stimulating autophagy. The nucleotide increases cellular levels of the autophagosome marker, LC3-II, and increases co-localization of LC3 with apoA-I in punctate autophagosomes. ADP affects autophagy and apoA-I secretion through P2Y(13). Overexpression of P2Y(13) increases cellular LC3-II levels by ~50% and blocks induction of apoA-I secretion. Conversely, a siRNA-induced reduction in P2Y(13) protein expression of 50% causes a similar reduction in cellular LC3-II levels and a 3-fold stimulation in apoA-I secretion. P2Y(13) gene silencing blocks the effects of ADP on autophagy and apoA-I secretion. A reduction in P2Y(13) expression suppresses ERK1/2 phosphorylation, increases the phosphorylation of IR-β and protein kinase B (Akt) >3-fold, and blocks the inhibition of Akt phosphorylation by TNFα and ADP. Conversely, increasing P2Y(13) expression significantly inhibits insulin-induced phosphorylation of insulin receptor (IR-β) and Akt, similar to that observed after treatment with ADP. Nucleotides therefore act through P2Y(13), ERK1/2 and insulin receptor signaling to stimulate autophagy and affect hepatic lipoprotein secretion.


Conflict of interest statement

Competing Interests: The authors have declared that no competing interests exist.

Figures

Figure 1
Figure 1. Extracellular nucleotides block the induction of apoA-I secretion.
HepG2 cells were pre-treated with adenosine diphosphate (ADP) (10 to 100 µM)) for 30 min. and then incubated with 12 µM DLPC in serum-free DMEM media. (A) Conditioned media was collected after 24 h and apoA-I concentration was quantified by ELISA. ApoA-I concentration in the media is normalized to total cell protein and expressed as mean ± SD of 3 independent experiments. *P<0.05 vs DLPC. (B) Conditioned media was collected after 4 h treatment with 100 µM ADP +/− DLPC and apoA-I concentration was quantified by ELISA. ApoA-I concentration in the media is normalized to total cell protein and expressed as mean ± SD of 3 independent experiments. *P<0.01 vs ADP, **P<0.001 vs Control, ***P<0.001 vs DLPC. (C) Cell lysates were collected after 4 h of treatment and apoA-I concentration was quantified by ELISA. ApoA-I concentration in the cell lysate is normalized to total cell protein and expressed as mean ± SD of 3 independent experiments.
Figure 2
Figure 2. ADP stimulates apoB100 and apoE secretion.
(A&B) HepG2 cells were incubated with 100 µM adenosine diphosphate (ADP) for 24 h in serum-free DMEM media. Conditioned media was collected and immunoblotted for apoB100 (A) and apoE (B). Histograms represent band densitometry analysis of apoB100 or apoE, normalized to total cell protein and expressed as mean ± SD of 3 independent experiments. *P<0.01 vs Control. (C&D) HepG2 cells were treated with 100 µM adenosine diphosphate (ADP) or 25 µM ALLN (N-Acetyl-L-leucyl-L-leucyl-L-norleucinal) for 4 h in serum-free DMEM media. (C) Conditioned media was collected and apoA-I concentration was quantified by ELISA. ApoA-I concentration in the media is normalized to total cell protein and expressed as mean ± SD of 3 independent experiments. *P<0.05 vs Control. (D) ApoB100 concentration in the media was determined by Western blot and histograms represent band densitometry analysis of apoB100, normalized to total cell protein and expressed as mean ± SD of 3 independent experiments. *P<0.05 vs Control.
Figure 3
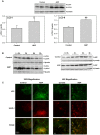
Figure 3. ADP stimulates autophagy and increases cellular LC3-II.
(A) HepG2 cells were treated with 100 µM adenosine diphosphate (ADP) for 4 h in serum-free DMEM media. Cell lysates were immunoblotted for LC3. Histograms represent band densitometry analysis of LC3-I and LC3-II, normalized to β-actin and expressed as mean ± SD of 3 independent experiments. *P<0.05 vs Control, **P<0.001 vs Control. (B) HepG2 cells were serum-starved (Control) or pretreated for 30 min. with 100 µM adenosine diphosphate (ADP) in serum-free DMEM media and then lysates were harvested at the indicated timepoints (0, 3, 6 & 9 h). (Left panels) Cell lysates were immunoblotted for LC3 and β-actin. (Right panels) Cell lysates were immunoblotted for p62 and β-actin. Blots are representative of 2 independent experiments. (C) HepG2 cells were serum-starved (Control) or treated with 100 µM ADP in serum-free DMEM media for 4 h. Cells were fixed and permeabilized and then LC3 and apoA-I were detected by indirect immunofluorescence using primary antibodies against human LC3 and apoA-I, and Alexa Fluor-conjugated secondary antibodies (Alexa Fluor 488 goat anti-rabbit Ab (green for LC3) and Alexa Fluor 647 anti-mouse Ab (red for apoA-I)) by confocal microscopy. Micrograph 100× and 40× images of representative cells from 2 independent experiments done in quadruplicate are shown.
Figure 4
Figure 4. Increasing P2Y13 expression stimulates autophagy and blocks apoA-I secretion.
HepG2 cells were transfected with either a control pCMV plasmid (pCMV) or a pCMV plasmid expressing human P2Y13 (pCMV-P2Y13). Cell lysates were collected 48 h after transfection and immunoblotted for P2Y13 to measure protein overexpression (Upper left panel). Histograms represent band densitometry analysis of P2Y13, normalized to β-actin (inset A) and expressed as mean ± SD of 3 independent experiments. *P<0.05 vs pCMV. (A) Cell lysates were immunoblotted for LC3 and histograms represent band densitometry analysis of LC3-II, normalized to β-actin and expressed as mean ± SD of 3 independent experiments. *P<0.05 vs pCMV. (B) Transfected cells were treated with 100 µM ADP in serum-free DMEM media for 4 h, conditioned media was collected and apoA-I concentration was quantified by ELISA. ApoA-I concentration in the media is normalized to total cell protein and expressed as mean ± SD of 3 independent experiments. *P<0.05 vs pCMV Control. (C) Transfected cells were treated with 12 µM DLPC in serum-free DMEM media for 24 h, conditioned media was collected and apoA-I concentration was quantified by ELISA. ApoA-I concentration in the media is normalized to total cell protein and expressed as mean ± SD of 3 independent experiments. *P<0.01 vs pCMV Control, **P<0.01 vs pCMV+DLPC.
Figure 5
Figure 5. Reducing P2Y13 expression blocks autophagy and stimulates apoA-I secretion.
HepG2 cells were transfected with either a negative control (si-ctrl) or a siRNA against human P2Y13. Cell lysates were collected 48 h after transfection and immunoblotted for P2Y13 to confirm protein knockdown (Upper left panel). (A) Cell lysates were immunoblotted for LC3 and histograms represent band densitometry analysis of LC3-II, normalized to β-actin, and expressed as mean ± SD of 3 independent experiments. *P<0.05 vs si-Ctrl. (Inset A) Histograms represent band densitometry analysis of P2Y13 normalized to β-actin and expressed as mean ± SD of 3 independent experiments. *P<0.05 vs si-Ctrl. (B) Transfected cells were treated with 100 µM ADP in serum-free DMEM media for 4 h, conditioned media was collected and apoA-I concentration was quantified by ELISA. ApoA-I concentration in the media is normalized to total cell protein and expressed as mean ± SD of 3 independent experiments. *P<0.05 vs si-Ctrl, **P<0.05 vs si-P2Y13 (C) Transfected cells were treated with 12 µM DLPC in serum-free DMEM media for 24 h, conditioned media was collected and apoA-I concentration was quantified by ELISA. ApoA-I concentration in the media is normalized to total cell protein and expressed as mean ± SD of 3 independent experiments. *P<0.01 vs si-Ctrl, **P<0.001 vs si-Ctrl+DLPC.
Figure 6
Figure 6. Extracellular nucleotides and P2Y13 expression regulate ERK1/2 signaling.
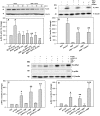
(A) HepG2 cells were pre-treated with 12 µM DLPC for 30 min. and then incubated with and without ADP (100 µM) for 0, 5, 15 and 30 min in DMEM serum-free media. Cell lysates were immunoblotted for phosphorylated ERK1/2. Histograms represent densitometry analysis of p-ERK1/2 normalized to β-actin and expressed as mean percent change ± SD of 3 independent experiments. *P<0.01 vs Ctrl, **P<0.05 vs ADP 5 min. (B) HepG2 cells were transfected with either negative control (si-Ctrl) or P2Y13 siRNA (si-P2Y13) and incubated for 24 h. Cell lysates were immunoblotted for phosphorylated and total ERK1/2. Histograms represent band densitometry analysis of the ratio of phospho-ERK1/2 (p-ERK1/2) to total ERK1/2 (t-ERK1/2) and are expressed as mean ± SD for 3 independent experiments. *P<0.05 vs. control siRNA.
Figure 7
Figure 7. Extracellular nucleotides and P2Y13 expression regulate insulin receptor signaling.
(A) HepG2 cells were pre-treated with 12 µM DLPC for 30 min. and then incubated with and without ADP (100 µM) for 0, 5, 15 and 30 min in DMEM serum-free media. Cell lysates were immunoblotted for phosphorylated Akt (Ser473). Histograms represent densitometry analysis of p-Akt normalized to β-actin and expressed as mean percent change ± SD of 3 independent experiments. *P<0.01 vs Control, **P<0.001 vs DLPC 5 min. (B) HepG2 cells were pre-treated with adenosine diphosphate (ADP) (100 µM) or TNFα (10 ng/ml) for 5 min. and then with human insulin (100 nM) for 5 min in DMEM serum-free media. Cell lysates were immunoblotted for phosphorylated Akt (Ser473). Histograms represent densitometry analysis of p-Akt normalized to β-actin and expressed as mean ± SD for 3 independent experiments. *P<0.001 vs Ctrl, **P<0.001 vs. insulin alone. (C&D) HepG2 cells were transfected with either negative control (si-Ctrl) or P2Y13 siRNA (si-P2Y13) and incubated for 48 h. Cells were then treated with adenosine diphosphate (ADP) (100 µM) or TNFα (10 ng/ml) for 5 min. in DMEM serum-free media. (C) Cell lysates were immunoblotted for phosphorylated insulin receptor (IR-β) (Tyr1345). Histograms represent densitometry analysis of p-IR-β normalized to β-actin and expressed as mean ± SD for 3 independent experiments. *P<0.01 vs si-Ctrl, ** P<0.001 vs si-Ctrl. (D) Cell lysates were also immunoblotted for phosphorylated Akt (Ser473). Histograms represent densitometry analysis of p-Akt normalized to β-actin and expressed as mean ± SD for 3 independent experiments.*P<0.01 vs si-Ctrl, **P<0.05 vs. si-Ctrl, ***P<0.001 vs si-Ctrl.
Figure 8
Figure 8. Extracellular nucleotides act through P2Y13 to stimulate autophagy.
Elevations in blood glucose promote the secretion and accumulation of nucleotides in the circulation. Nucleotides act through P2Y13 to activate mitogenic pathways, inhibit insulin receptor signaling and stimulate autophagic protein degradation. Enhanced purinergic signaling in insulin resistance may give rise to a chronic induction of cellular autophagy and a reduction in apoA-I secretion from the liver.

Similar articles

Cited by

References

    1. Grundy SM. Hypertriglyceridemia, atherogenic dyslipidemia, and the metabolic syndrome. Am J Cardiol. 1998;81:18B–25B. - PubMed
    1. Adiels M, Olofsson SO, Taskinen MR, Boren J. Overproduction of very low-density lipoproteins is the hallmark of the dyslipidemia in the metabolic syndrome. Arterioscler Thromb Vasc Biol. 2008;28:1225–1236. - PubMed
    1. Solini A, Iacobini C, Ricci C, Chiozzi P, Amadio L, et al. Purinergic modulation of mesangial extracellular matrix production: role in diabetic and other glomerular diseases. Kidney Int. 2005;67:875–885. - PubMed
    1. Nilsson J, Nilsson LM, Chen YW, Molkentin JD, Erlinge D, et al. High glucose activates nuclear factor of activated T cells in native vascular smooth muscle. Arterioscler Thromb Vasc Biol. 2006;26:794–800. - PubMed
    1. Di VF, Solini A. P2 receptors: new potential players in atherosclerosis. Br J Pharmacol. 2002;135:831–842. - PMC - PubMed

Publication types

MeSH terms